


UX/UI Design Principles in Data Analytics Dashboards
When building dashboards for data analytics, it’s crucial to keep the user in mind in the design process. Dashboards add value by telling a story and showing actionable insights - not just displaying data. By incorporating UX/UI design principles, we can create dashboards that are intuitive, visually appealing, and impactful. Here are two key concepts to focus on: knowing the user through user stories and selecting the right charts for the metrics.
Knowing the User Through User Stories
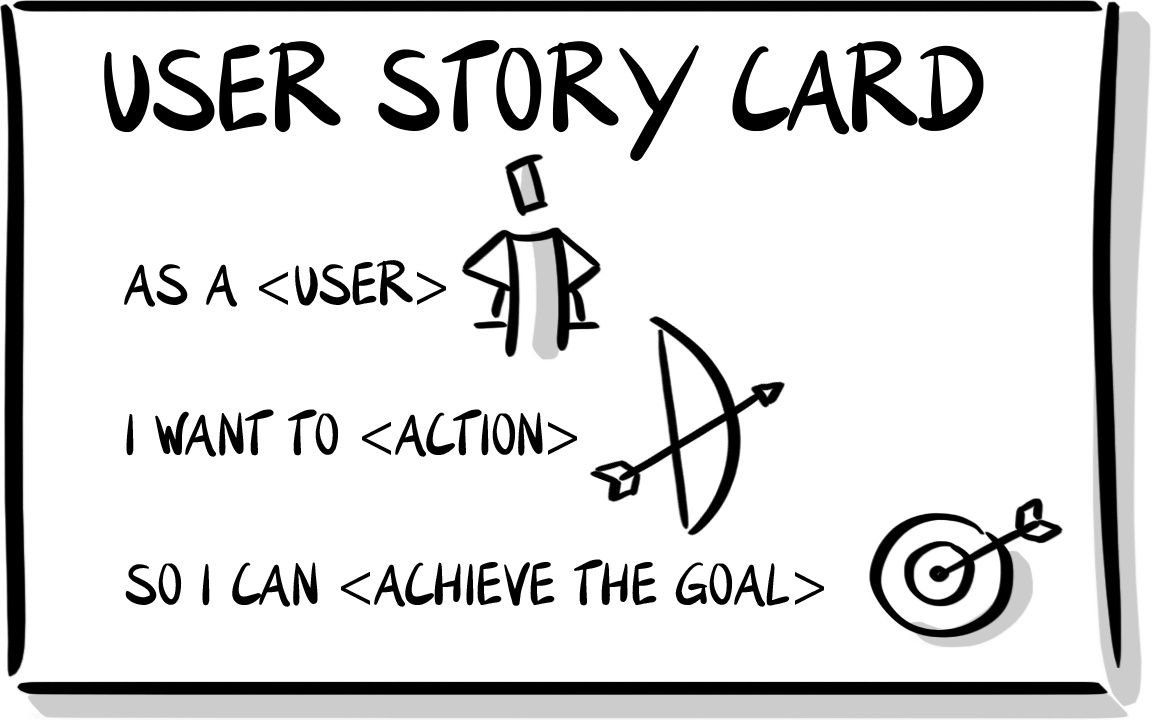
Understanding the user is the cornerstone of effective dashboard design. This begins with creating user stories. A user story outlines who the user is, what they need, and why they need it. For example:
- User: A sales manager.
- Need: To track monthly sales performance across regions.
- Why: To identify underperforming regions and allocate resources effectively.
Once you have clear user stories, you can tailor the dashboard’s layout, chart types, and functionality to meet those specifications. For the sales manager above, the dashboard might prioritize regional sales performance, trends over time, and a comparison against targets.
To truly know your users, ask questions about their daily challenges and goals. Understand how they will interact with the dashboard. Gather feedback on prototypes to ensure alignment with user expectations.
Selecting the Right Charts for the Metrics
Choosing the right visualization is just as important as understanding the user. The type of chart you select should align with the data’s purpose and the story you want to convey. Below are some common chart types and their best use cases:
- Bar Charts: Ideal for comparing discrete categories, such as sales by region or product performance.
- Line Charts: Perfect for showing trends over time, such as monthly revenue or website traffic.
- Pie Charts: Use sparingly, only to show proportions of a whole. For example, market share by competitor.
- Heat Maps: Useful for identifying patterns or correlations, such as customer churn rates by demographic.
- Scatter Plots: Great for exploring relationships between two variables, like ad spend and revenue.
A common mistake is overloading a dashboard with too many chart types, creating visual noise. Simplicity is key: ensure each chart adds value and contributes to the overall story.
With user stories as your foundation and the right charts as your tools, you can design dashboards that not only inform but also empower.