


Alteryx isn't just about end-to-end analytics — it also allows for process automation. You can build static reports and publish them straight onto Tableau Public, without the platform storing any data itself. GO OVER THIS
It also has over 260 tools, and analyses data using its AMP engine, which works through data in bulk (every 8 rows) rather than row by row making it have a faster processing speed. No other company can do this, as Alteryx holds the patent for it.
Before diving into the individual tools, there are a couple of general principles worth keeping in mind. Alteryx always works inside out when writing calculations, so it's worth understanding how the tool reads formulas before building anything complex. This can be very useful as it is not necessary to have different steps for different formulas if it's known that many formulas are needed.
Core Tools
Browse tool –
This renders maps in Alteryx, but can also act as a way of caching data. Worth noting that this caching can reduce performance, so it's not something to overuse.
Input Data –
Brings data in via a file path and can connect to cloud or server sources. It also allows for a wildcard union, making it useful when pulling in multiple similar files at once.
Text Input –
Allows you to manually input data, which is particularly useful for data that never changes. It's a quick way to manually create data and see how a process would look before applying it elsewhere.
Data Cleansing –
Removes whitespaces, sets cleaning processes, and clears up common errors in the dataset.
Filter –
Has a true and false anchor, meaning the tool doesn't get rid of any data outright but instead splits it into two separate streams.
Formula tool –
You can add multiple formulas using the (+) option, and they work iteratively, meaning each subsequent formula understands the output of the one before it. You can also save commonly used formulas for future use.
Sample –
Selects the top or bottom N records, but data needs to be sorted first. Can also create a random subset — though it's worth knowing that if you choose a random sample, the workflow will select a different sample each time it's refreshed. If you need the same sample consistently (for statistical purposes, for example), use the Random Sample tool instead.
Select –
Used to rename fields, change data types, remove fields, and reorder columns.
Sort –
Sorts data alphanumerically, as well as ascending or descending inv order.
Joins, Unions, and Appends
Join –
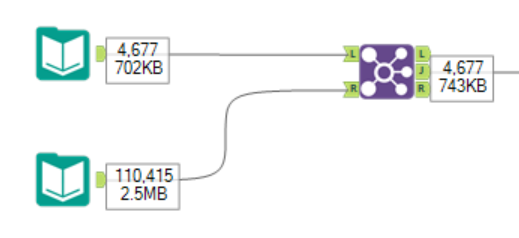
Joins two tables together. To make sure the granularity matches, you can match on multiple fields to avoid any data "explosion." There are three anchors — left, inner, and outer — depending on the outcome you want. When doing joins, it's important to check what the incoming rows look like so you can spot whether any duplication is occurring — this can save a lot of troubleshooting further down the line. In the example below, as there are 4,677 records on the first input then an inner join will result in 4,677 records, a purely left in 0 and a right in 109,397 records.
With joins, any data that doesn't match is routed to the left or right anchor as previously mentioned. To perform a left, inner, or outer join, you typically need two steps, which includes a union to bring the two join anchors back together. This is essentially what's happening in the background in tools like Tableau or Power BI.
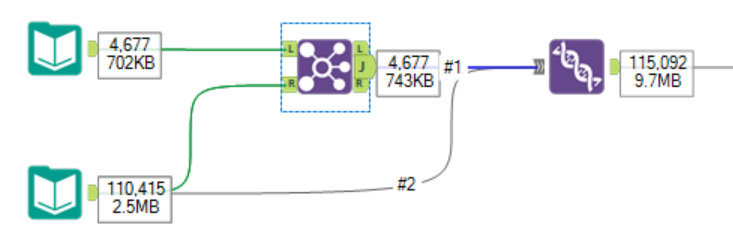
You can also change data types when connecting, and it's possible to join by record (row) position — though this is a bit risky, as it relies on the data being in exactly the same order.
Union –
Stacks multiple tables on top of each other, it can also be used to make right, left and outer joins.
Append –
A sort of scaffolding tool where data can be cross-joined to a dataset. It joins everything from the source to everything in the target, but has a limit of 16 records unless you manually increase it — anything beyond that will return an error.
Reshaping and Summarising Data
Summarize –
Allows you to aggregate and summarise data. The same column can be used multiple times (for example, both a count and a group by), and it works similarly to the Aggregate step in Tableau Prep.
Transpose and Cross Tab are used when data isn't laid out in the way you need it to be visualised. It's worth remembering that the way data is presented also affects how the program reads and stores it.
Transpose –
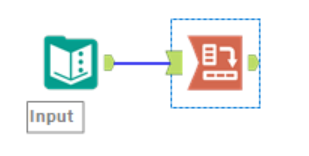
Takes many columns and turns them into more rows. Key fields are kept as columns, while the remaining fields are the ones you choose to transpose.
Cross Tab –
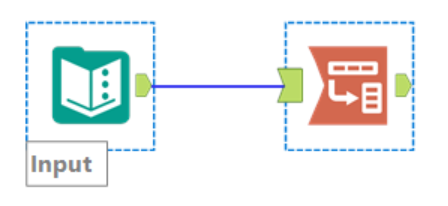
Essentially the opposite of Transpose. You specify the column header, the data field, and the grouping.
One thing to flag: Alteryx now uses underscores for whitespaces. If you retain special characters, the whitespaces will stay as they are, since Alteryx treats them as special characters. It's also worth noting that Count and CountD aren't generally recommended, as they only return a record count — with other options, you can instead show what the actual value is per row.
There's also a setting for handling dynamic or unknown fields, which is useful for managing any new fields that might be added in the future.
Working with Records
Record ID –
Creates a new column that assigns a unique number to each row.
Select Records –
Lets you visualise a specific set of rows at different points in the dataset, using a from-here-to-here approach.
Unique –
Looks for unique rows based on a specific field. It doesn't check for duplicate data directly, but instead has two outputs: one showing unique values (records that appear only once), and the other showing duplicates (all repeated values).