Within the paradigm of statistics, quartiles are a key type of quantile that allow you to observe the distribution of values in a data set at a more granular level, compared to solely using, say, the mean, or the minimum and maximum. The distribution can then be utilised to determine whether or not the data is skewed toward one side, allowing you to discern outliers in the data too. As the name suggests, data points in the data set are split into four, with the key quartiles being; the lower quartile (Q1) represents the value at which 25% of the data set is below, the second quartile (Q2) represents the value at which 50% of the data set is below, and the upper quartile (Q2) represents the value at which 75% of the data set is below. From this standpoint, the minimum and the maximum are readily determinable too.
It is important to note, however, that there is no universally agreed on technique for determining quartile values, so we’ll focus on two of the most common techniques as examples below.
Method 1:
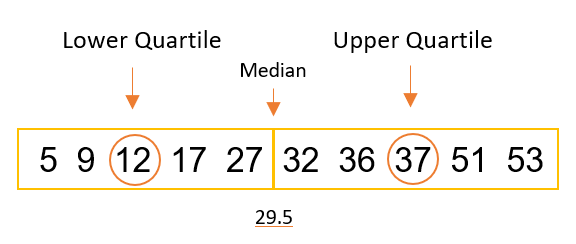
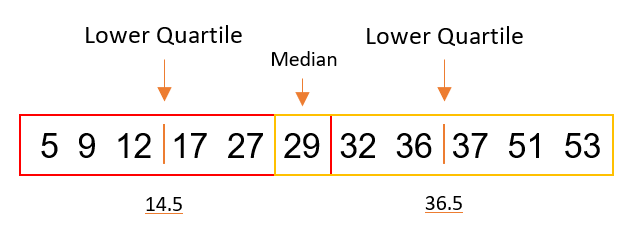
For this method the median should be used to split the data set in half (values must be ordered). EITHER: Do not include median if odd number of data points OR split directly in half if even number of data points. The lower quartile value is the median of the first half, and the upper quartile value is the median of the second half like, like below:
Odd no. of data points:

Even no. of data points:

Method 2:
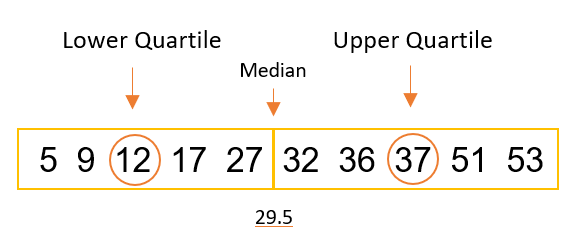
Moving on, this next method is actually utilised within Tableau’s software, with its calculated quartiles known as Tukey’s Hinges. For this method, the median is used again to split the data into two-halves (values must be ordered). EITHER: Include median if odd number of data points OR split directly in half if even number of data points. The lower quartile value is the median of the lower half, and the upper quartile value is the median of the upper half.
Odd no. of data points:

Even no. of data points:

