Now when you think about data analysis, I’m probably right in assuming that colour is not the first thing to pop into your head, with many other factors tending to take precedence over such a concept. However, within the realm of data visualisation, an individual's use of colour can have a significant impact on the way others perceive and understand information within a chart or dashboard, as well as allowing such information to become far more visually appealing to the user. With this in mind, below are 4 key factors that I like to be wary of before I start building a visualisation in Tableau:
(1) Consider your audience:
Naturally we want our visualisation to be as inclusive and accessible as possible, therefore visual impairments such as colour blindness must be considered. This is easily remedied by searching online for suitable colour palettes, or using online tools such as Adobe Color to check for any conflicts within an already chosen palette (see https://color.adobe.com/create/color-accessibility).
(2) HSB!:
Drill that acronym into your head because Hue, Saturation, and Brightness are the 3 fundamental building blocks to make use of when utilising colours for your visualisation. Hue can be described as pure colour, corresponding to a specific point on a colour wheel (measured in degrees) where both the saturation and brightness at 100%. Saturation (or colourfulness/ chroma) refers to how rich or intense the colour (hue) is, and is commonly measured in percentages from 0% to 100%; 0% being the lowest saturation (pure grey) and 100% being the highest (pure colour). The lower the saturation the more pastel-like the colour will be. Lastly is brightness which is also measured in percentages from 0% to 100%. The lower the percentage the closer to black the colour will be, therefore this term is often used interchangeably with lightness or shade.

Test it out for yourself at Adobe Color and see what colour combinations you can come up with using these 3 building blocks! It is important to note, however, that the use of pure colour is largely discouraged within visualisations, as it can be rather unpleasant on the eyes, and can also evoke feelings of stress and tension for a user.
(3) Don’t over do it!:
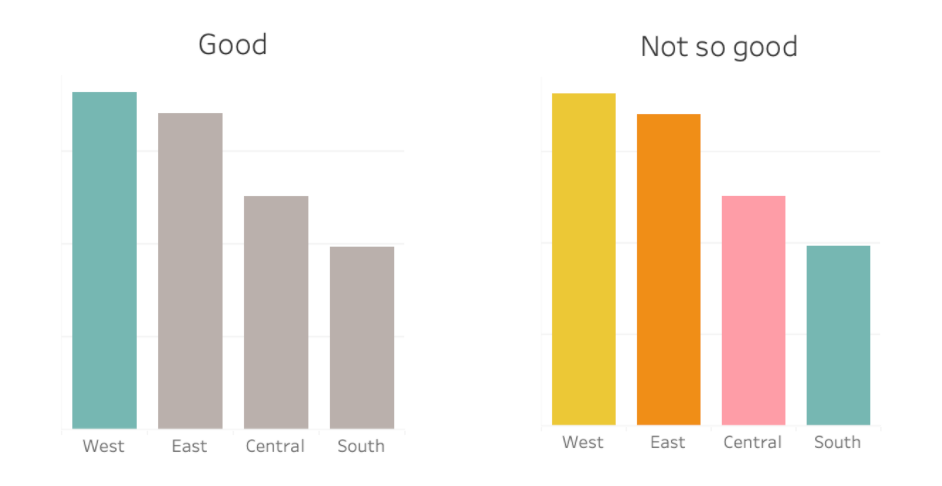
Although colour can aid in engaging the user, too much colour can cause a visualisation to become cluttered and chaotic, rendering the information within it much harder to decipher. As such, whenever you’re looking to include colour within your visualisation, it is always best to first ask yourself if it is necessary and appropriate for the dashboard. For example, does a chart need to include a colour per category, or would it look better using one colour to highlight a specific category? See for yourself below.

(4) Five colour palette:
One key rule I always tend to stick with when utilising colour within Tableau, is the 5 colour palette. Within this palette there should be a main colour (usually a muted tone), 2 highlight colours (to differentiate between different metrics), a positive colour (to note positive insights), and a negative colour (to note negative insights); see the example below. Not only will the dashboard appear much more cohesive and consistent, but it will also allow the user to recognise trends and patterns within the data far more effortlessly, which is ultimately the key goal of any data visualisation. I got this rule from Ellen Blackburn's Youtube video on dashboard design (https://www.youtube.com/watch?v=KiIDu-6ZSYc&t=383s), so check it out if you want a more detailed understanding of colour, and design as a whole.

