Today's task has been to build a KPI dashboard using Power BI and one of the sample datasets found here. Let me share with you how that went down.
Getting & Evaluating the Data
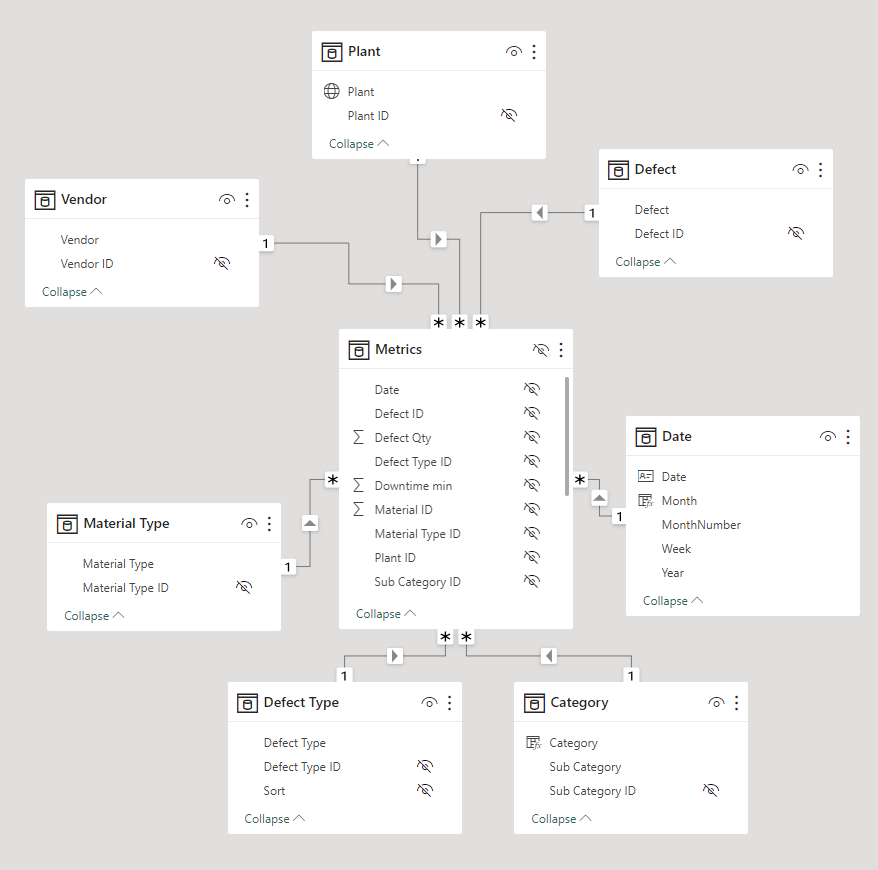
The data turned out to be available as a ready-to-use data model in the Power Pivot format. So low barriers there and more time to focus on the end result. I decided to visualize this dataset that contains supplier quality analysis data. This is what the data model looks liek after importing the data in Power BI:

So what have we got here in general?
- "Metrics" main table: Contains the quantity of defect items & resulting downtime minutes. Also all IDs to the lookup tables are stored here.
- "Defect": Descriptions like "Wrong Size", "Bad Seams", "Misc", etc.
- "Defect Type": 3 possible values: "Rejected", "Impact", "No Impact"
- "Material Type": "Labels", "Packaging", "Carton", "Glass", "Hardware", ...
- "Vendor": Vendor names
- "Category": "Packaging", "Logistics", "Mechanicals", ...
- "Plant": Geodata of plant locations in USA
So what is one row of data in the main table?
1 row represents 1 defect batch of items of a certain quantity from 1 vendor, with added information like date, material, plant, downtime minutes, etc.
The Plan
Just to mix things up a little, I'm focusing on interactivity andUXX this time. The plan is to have a tool that's very easy to comprehend and that makes the worst entities in the data (vendors, defect categories) stick out.

The Dashboard
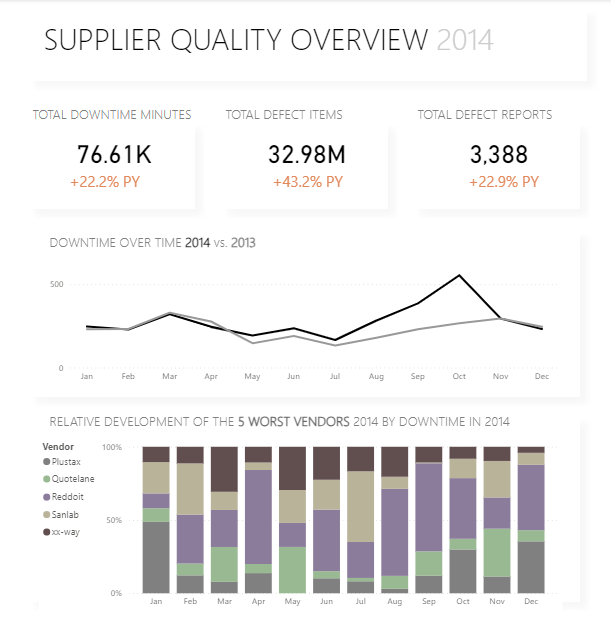
This is the final product. I think especially the upper part is pretty intuitive to grasp. The KPIs double as buttons changing the charts underneath to refer to the respective KPI category. I was going for a clean design. A next step one could think of would be to change the color palette of the stacked bar chart to something else that fits the light design of the rest of the dashboard better.

