


In my last post, I demonstrated how to color the quadrants of a scatter plot using Table Calculations and average reference lines. But what if you want to achieve the same result using Level of Detail (LOD) Expressions instead? The good news is, you can, and it’s fairly straightforward once you understand how nested LODs work.
1. Build the Scatter Plot
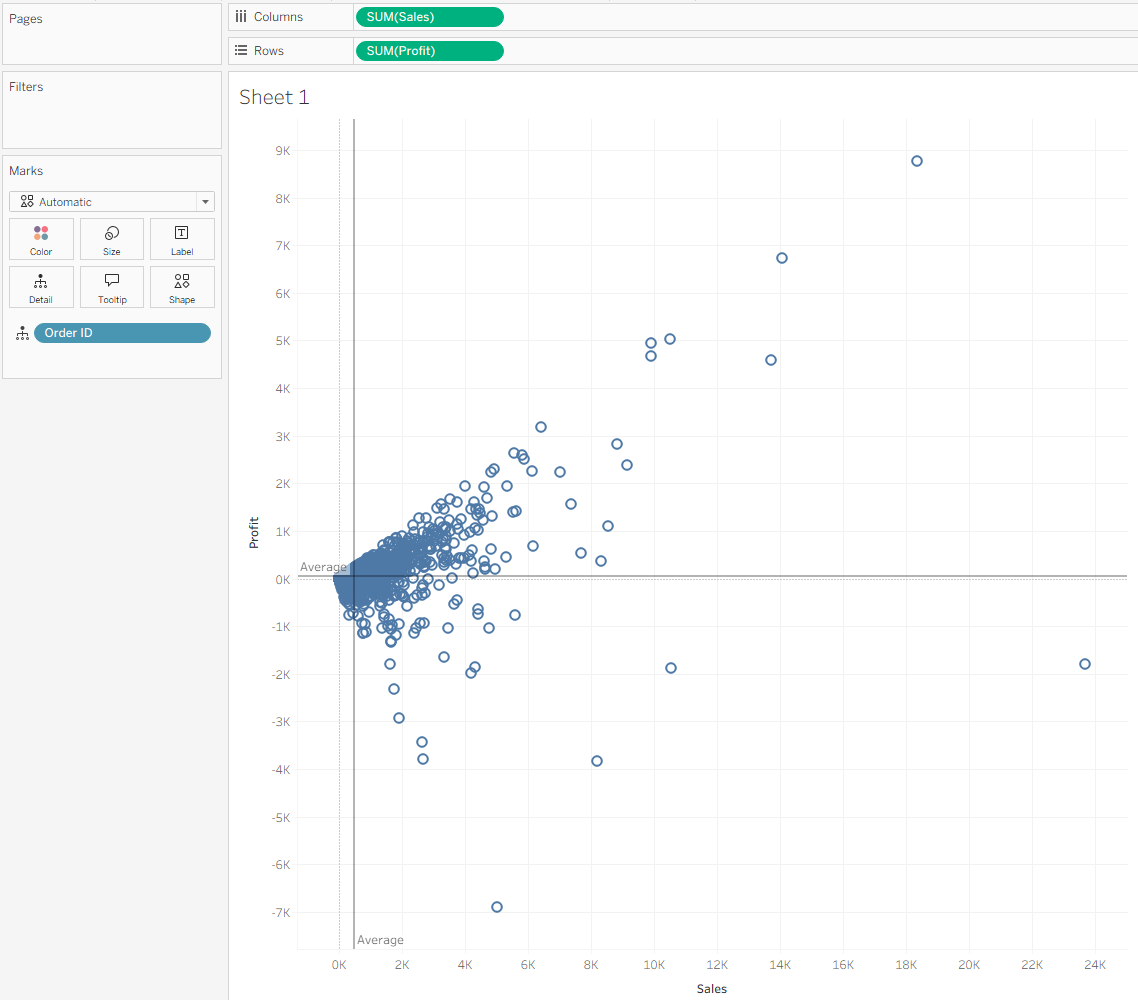
Start by creating a basic scatter plot:
- Drag SUM(Sales) to Columns
- Drag SUM(Profit) to Rows
- Place Order ID on the Detail mark so each mark represents an individual order
- Add two Average reference lines (one for Sales and one for Profit) from the Analytics pane
These reference lines help you visually verify that your LOD-based logic matches the view’s averages.
2. Create the Nested LOD for Average Sales per Order
We want to compute the average of the Sales amount per Order ID—the same thing that the reference line is doing in the view.
Create the following calculated field:
LOD Sales Avg
- { FIXED : AVG({ FIXED [Order ID] : SUM([Sales]) }) }
How it works:
- The inner LOD { FIXED [Order ID] : SUM([Sales]) } calculates the total Sales for each Order ID, matching the grain of the scatter plot marks.
- The outer LOD { FIXED : AVG( … ) } takes the average of all those per-order Sales totals, regardless of what dimensions are on the view.
This ensures the value matches the reference line even if filters or dimensions change.

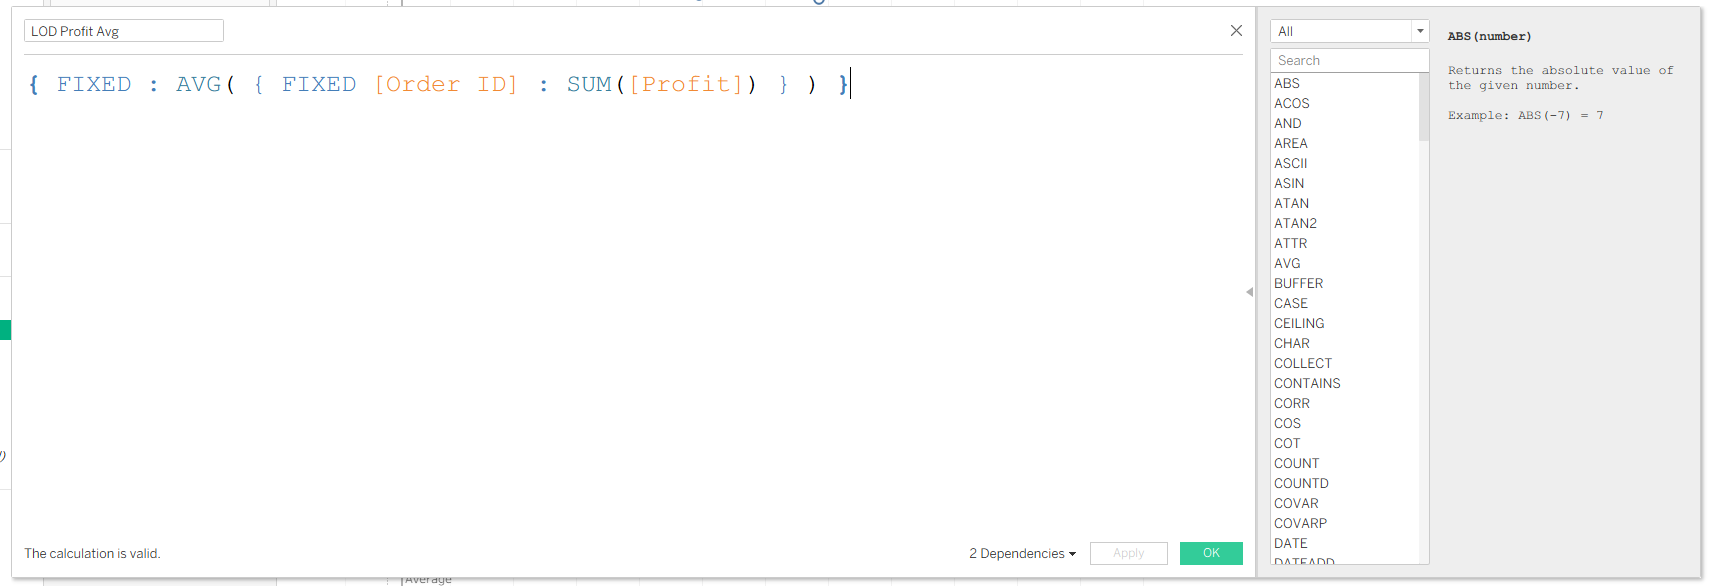
3. Create the Nested LOD for Average Profit per Order
Repeat the same pattern for Profit:
LOD Profit Avg
- { FIXED : AVG({ FIXED [Order ID] : SUM([Profit]) }) }
Again, the inner expression computes Profit per order, and the outer expression calculates the overall average across all orders.
4. Create the Boolean Field for Quadrant Classification
Now we need a Boolean to identify which marks sit above or below each average.
Create a calculation:
Above Avg Quadrant Boolean
SUM([Sales]) > MIN([LOD Sales Avg])
AND
SUM([Profit]) > MIN([LOD Profit Avg])
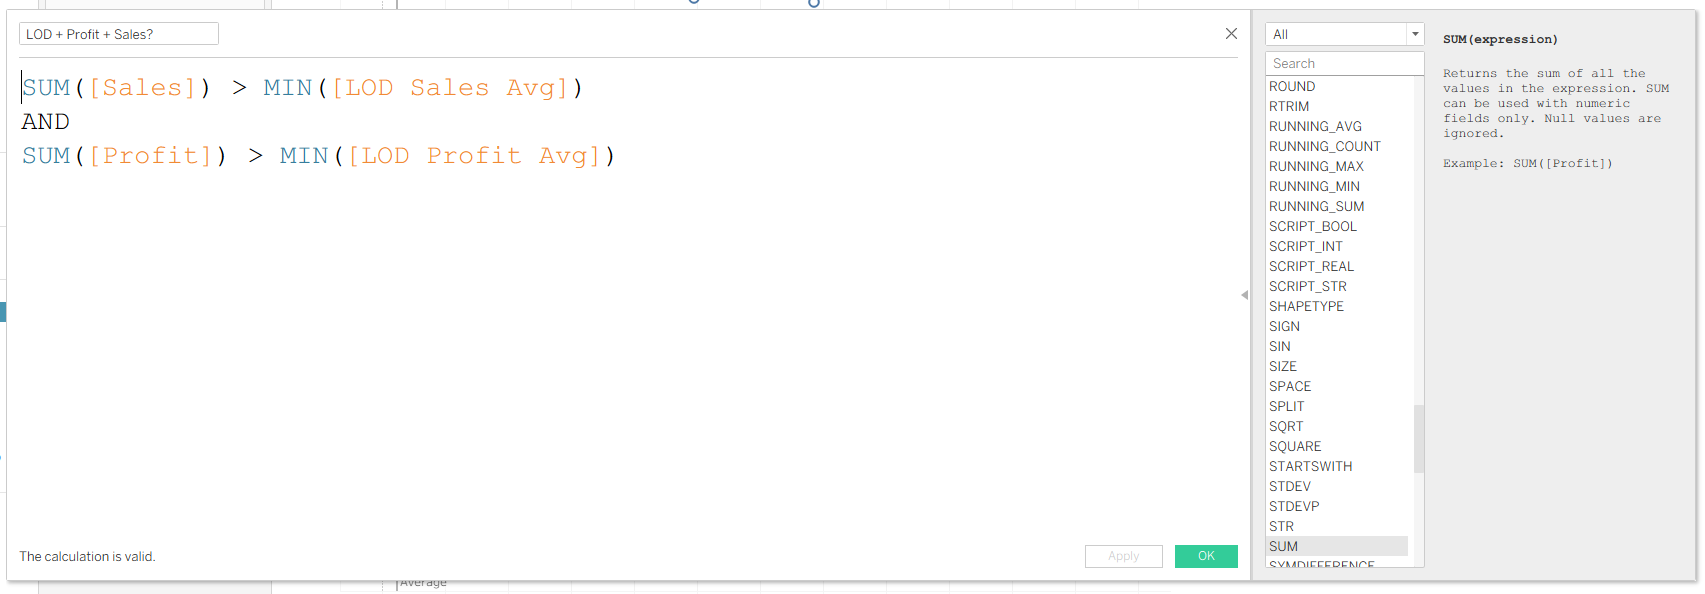
Why wrap the LODs in MIN()?
LOD expressions return aggregated values, while SUM([Sales]) and SUM([Profit]) are also aggregates. Tableau requires that both sides of a comparison be aggregated the same way. Wrapping the LOD results in MIN() (or MAX() or AVG()) prevents the “cannot mix aggregate and non-aggregate” error.
5. Color the Scatter Plot
Drag your Boolean field onto Color.
Marks that satisfy the condition (above both the Sales and Profit averages) will appear in one color, while all others will appear in another. You can extend this to create four quadrants using additional logic if desired.

Final Notes
- Nested LODs are a powerful way to replicate view-level table calculations in a way that stays stable even when you change the structure of the visualization.
- If the averages do not match your reference lines, check whether your filters are set to Context, as FIXED LODs ignore most filters unless they are in context.