Filtering is not always the solution! I came to this realisation during one of our last customer projects. The customer wanted to focus dynamically on chosen timeframes without filtering. In this way, it would be possible to compare the specific period to the rest of the year in the same chart.
I would like to explain how this is possible in Tableau using the following example. In this example, the Superstore data set is used to visualise Sales by Day(Order Date) in the form of a bar chart.
Step 1: Create a Parameter
The first step is to create a parameter. It allows us to decide later on from which date we want to highlight a specific time period. To create a parameter, you can click on the drop-down caret in the right-hand Tableau menu bar and select Create Parameter.

The parameter should then be configured as shown in the following screenshot. It doesn't matter which date is specified in the current value.

Step 2: Create a Calculated Field
In the second step a calculated field has be created. It allows us to define the time period to be highlighted depending on the parameter. To do this, first click on the drop-down caret in the right-hand tableau menu bar and select Create Calculated Field.

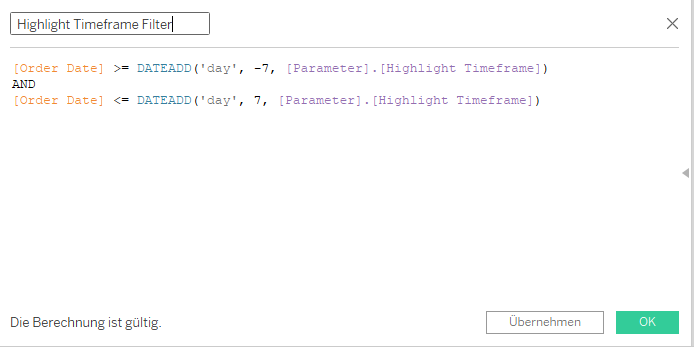
You can then enter the following calculation:

The DATEADD function is used here to display seven days before and after the date based on the date selected in the parameter. You can of course select a different time period by replacing the seven in the calculation with a different number.
Now all you have to do is bring the new calculated field to colour in the Marks area and display/show the parameter.


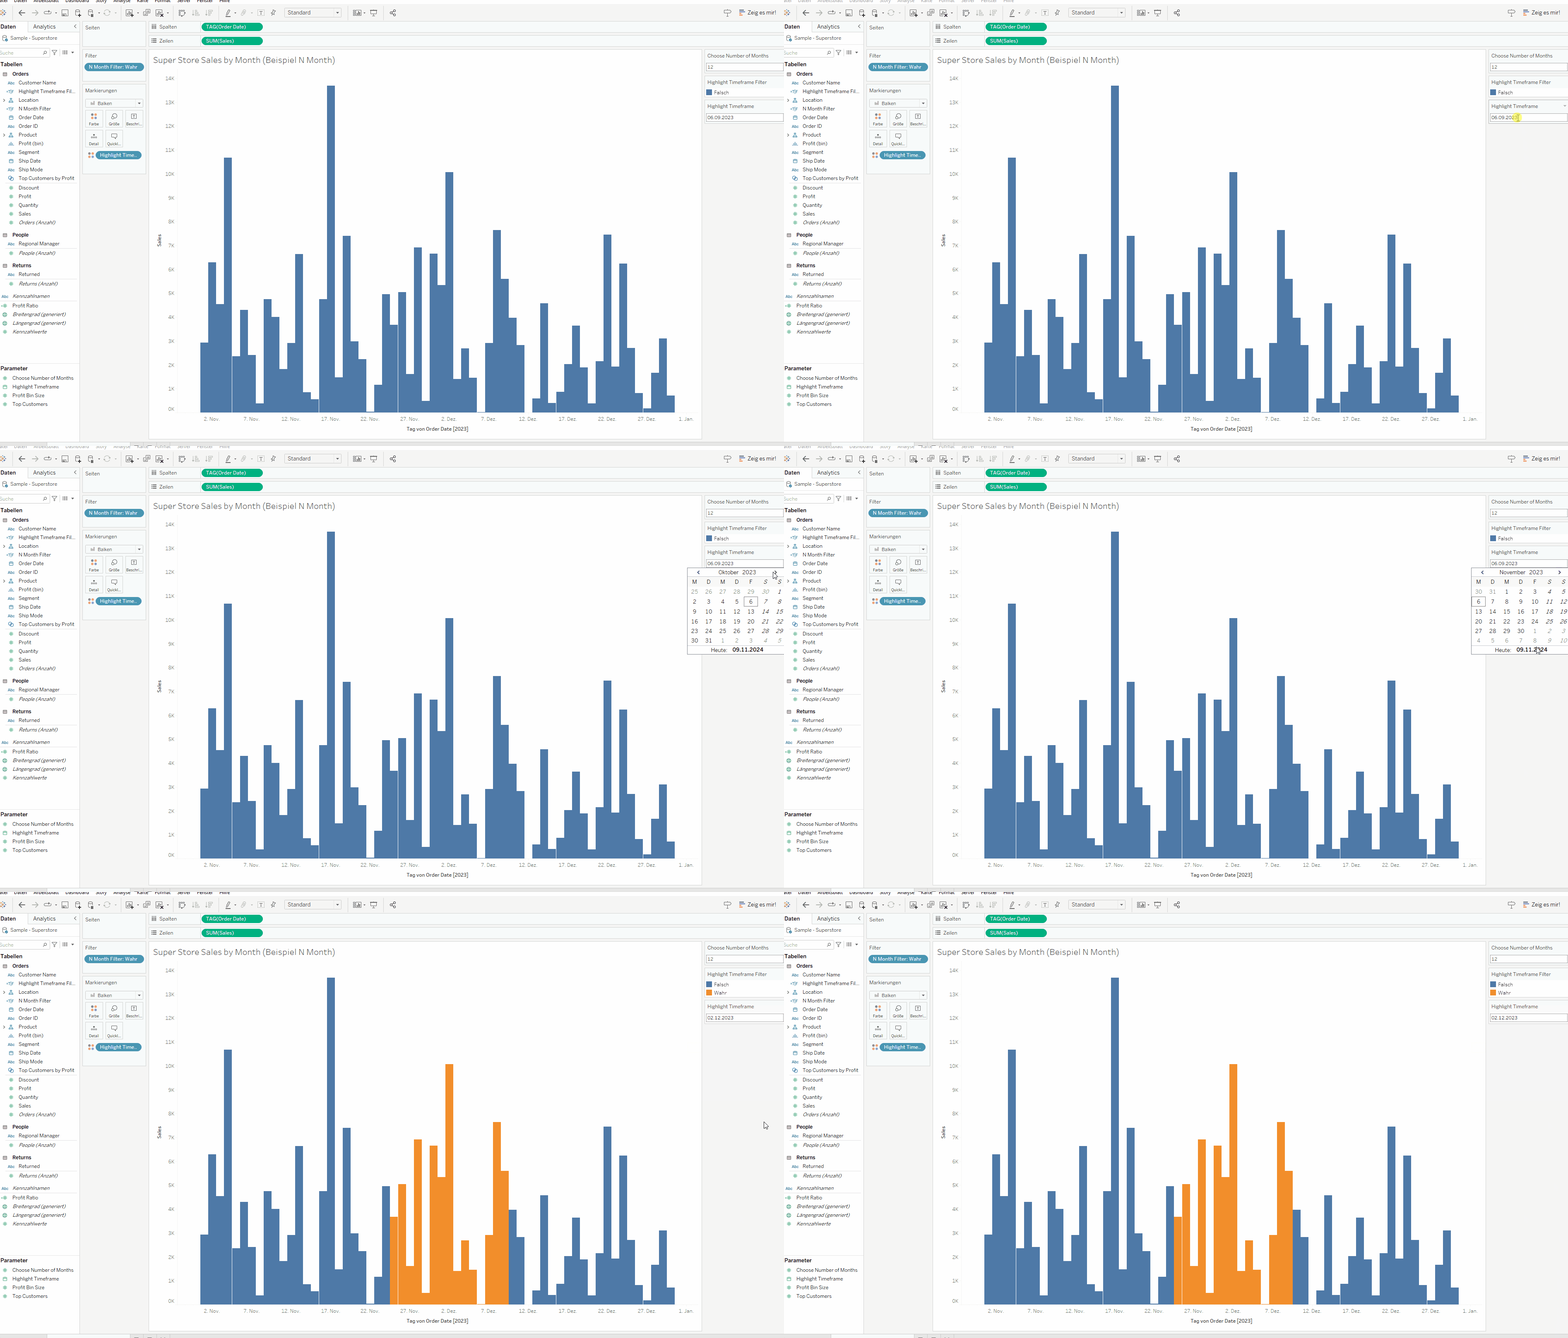
If you then select a specific date in the parameter, you will see the defined time period around the selected date highlighted.
It could look like this:

