


Our second day in the Dashboard week had the topic KPIs and done in Power BI. Our data set contained the familiar Super Store data set but arranged in a Star Shema as you can see below:
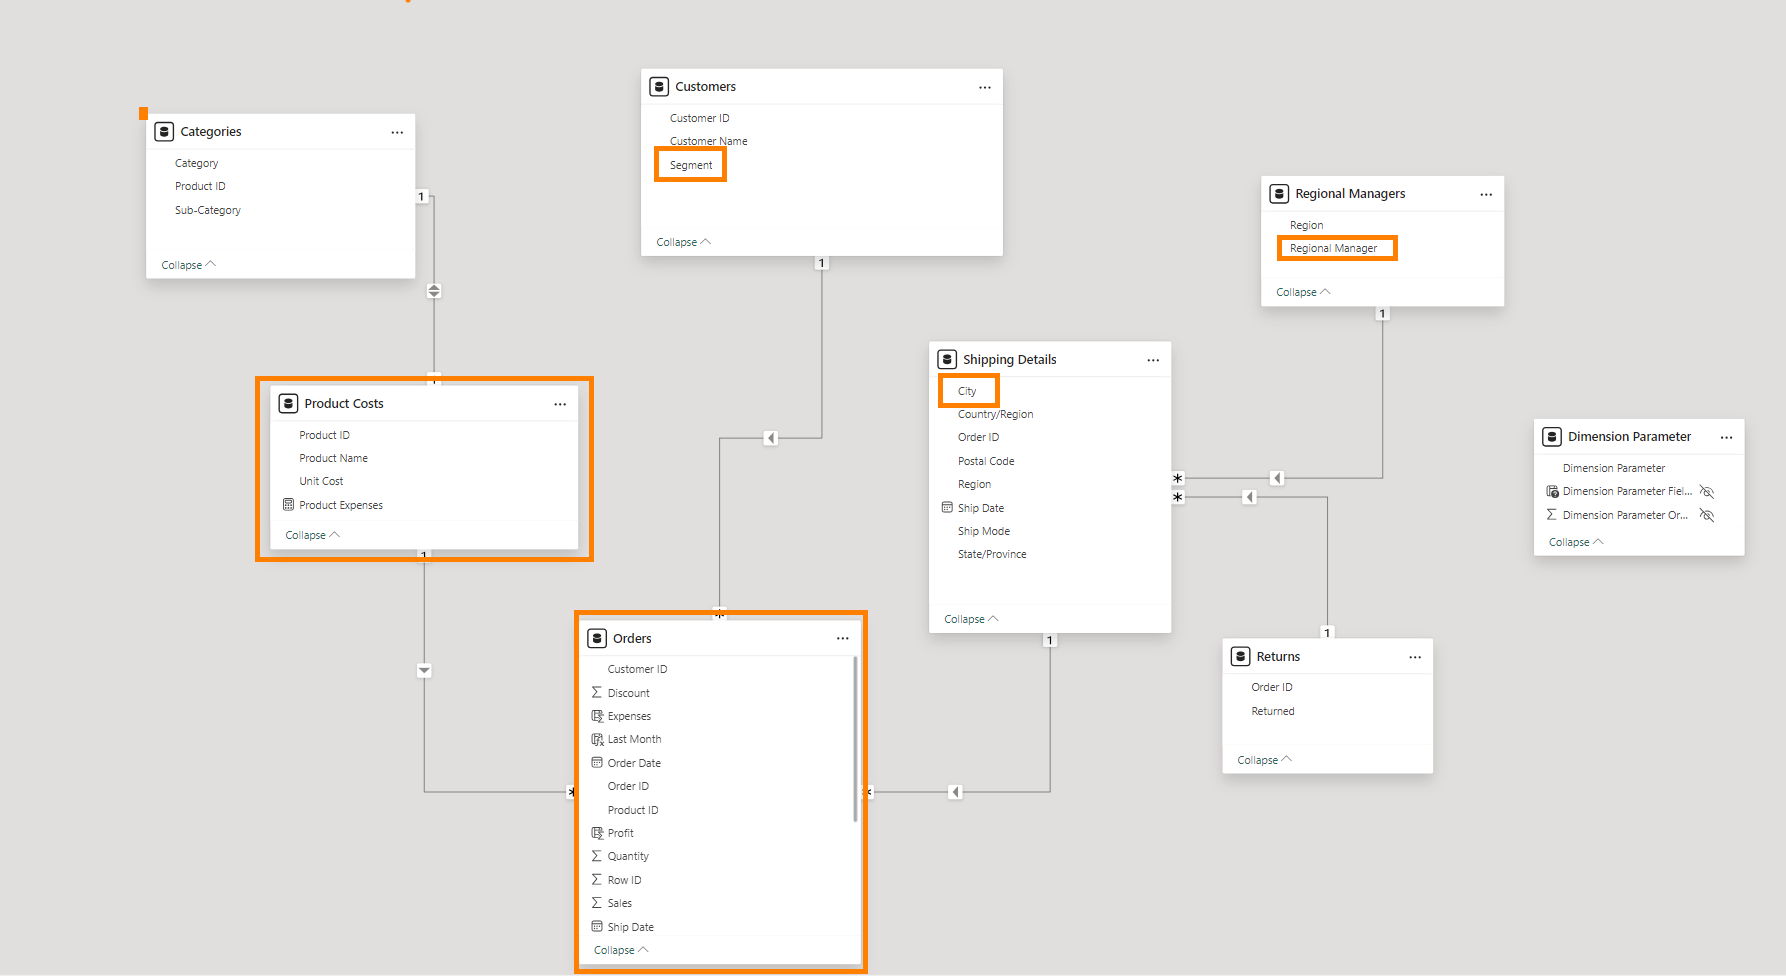
I have highlighted the data that I have used for my use case in the screenshot.
Idea:
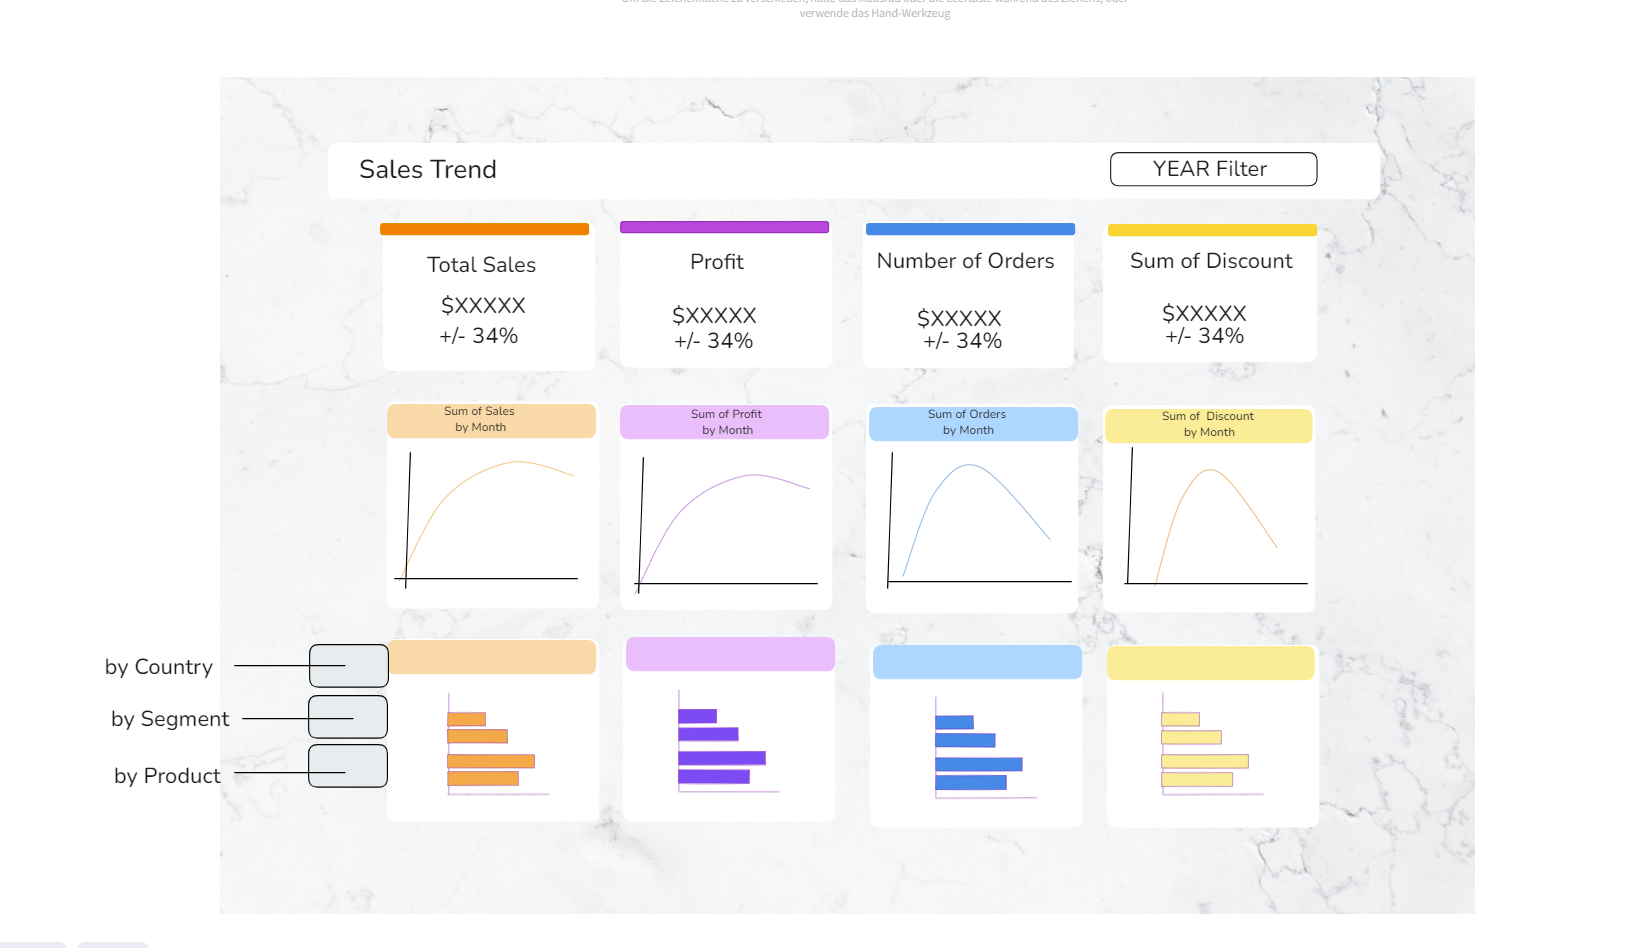
My idea was to provide an overview of the most important key measures and thus to provide a starting point for deeper analyses in the future. That's why I focused on four measures Sales, Profit, Quantity (Order Number) and Average Discount in my report. The first level of the report shows the KPIs for the month with an indication of the percentage difference compared to the previous month. The second level shows the development of the measures by month for a year. And finally in bar chart section the report shows for example sales by country to give a little bit more inside into whether sales depends on region or city or product. I created my sketch in Excalidraw and it looks like this:
Result:
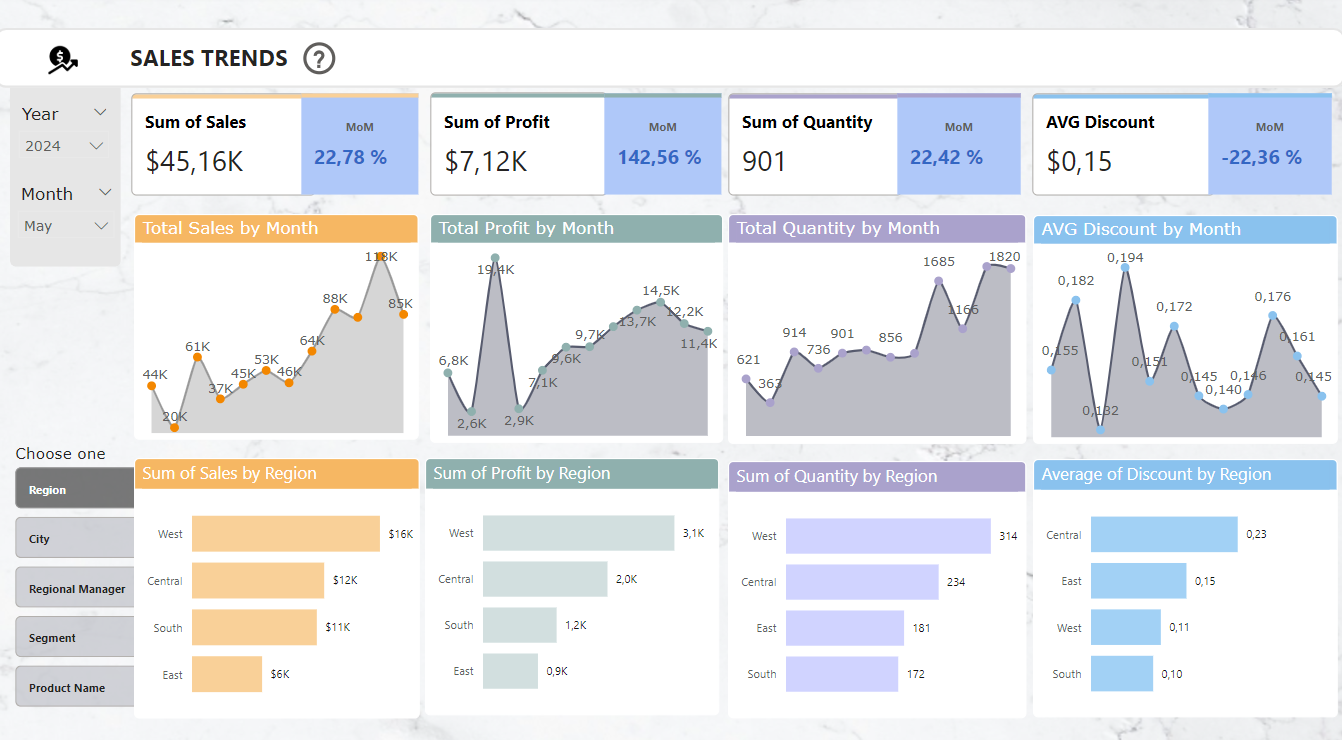
I am quite happy with my result, as I was able to implement all my ideas, although some fine-tuning is still necessary to optimise the report, such as adjusting the titles of the charts. You can see my final report here:
Challenges & Feedback:
Personally, I was most challenged by the creation of the KPIs and the MoMs, i.e. the comparison with the previous month, as I had never created this form of KPI visualisation before and I personally find the KPI options in Power BI somewhat cumbersome. I therefore worked with a workaround and two separate card charts, which I also colour-coded to show that there is a positive or negative percentage difference compared to the selected month.
I also received feedback that the data labels in the area chart could be used only for max and min, for example, to make the chart clearer. In addition, a different colour scheme could be considered and the titles could also be adapted so that they do not take up too much space and are also suitable for the visualisation.