


Filtering data is an essential function in Tableau. In general, the filters are transferred directly to the dashboard and the visualisations changes as soon as something is selected in the filter.
However, if several filters are to be changed at the same time, the direct adjustment of the data after each individual filter can be disruptive and will probably take longer, especially if a large amount of data is involved.
In such cases, it is possible to place a so-called Apply Button in the dashboard. This makes it possible to first set all filters according to the desired search criteria and only execute them by clicking on the Apply Button.
I would like to share with you how the Apply Button can be created.
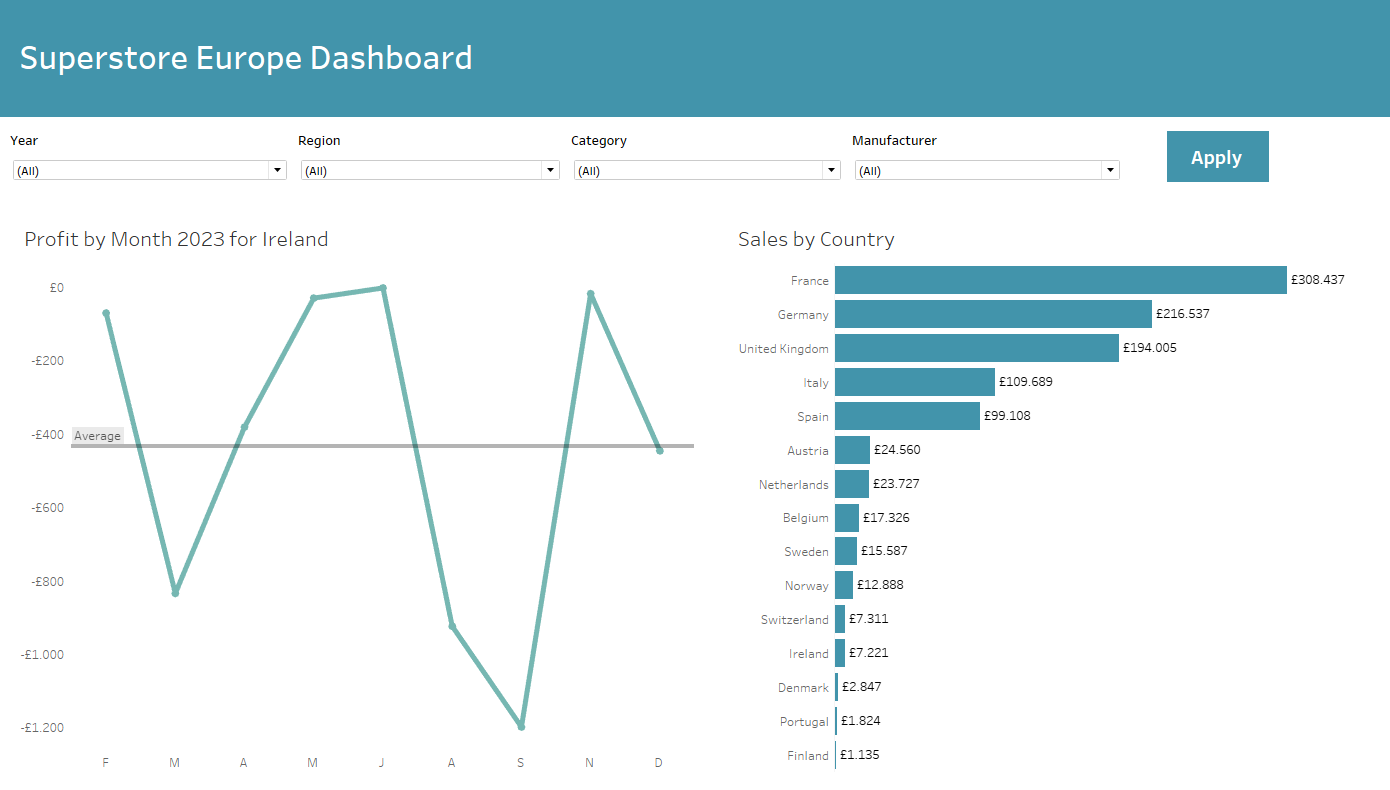
The example I use is based on the Superstore Europe data set and in order to set up the Apply Button, one, two or more charts should already be placed in a dashboard.
It could look something like this:
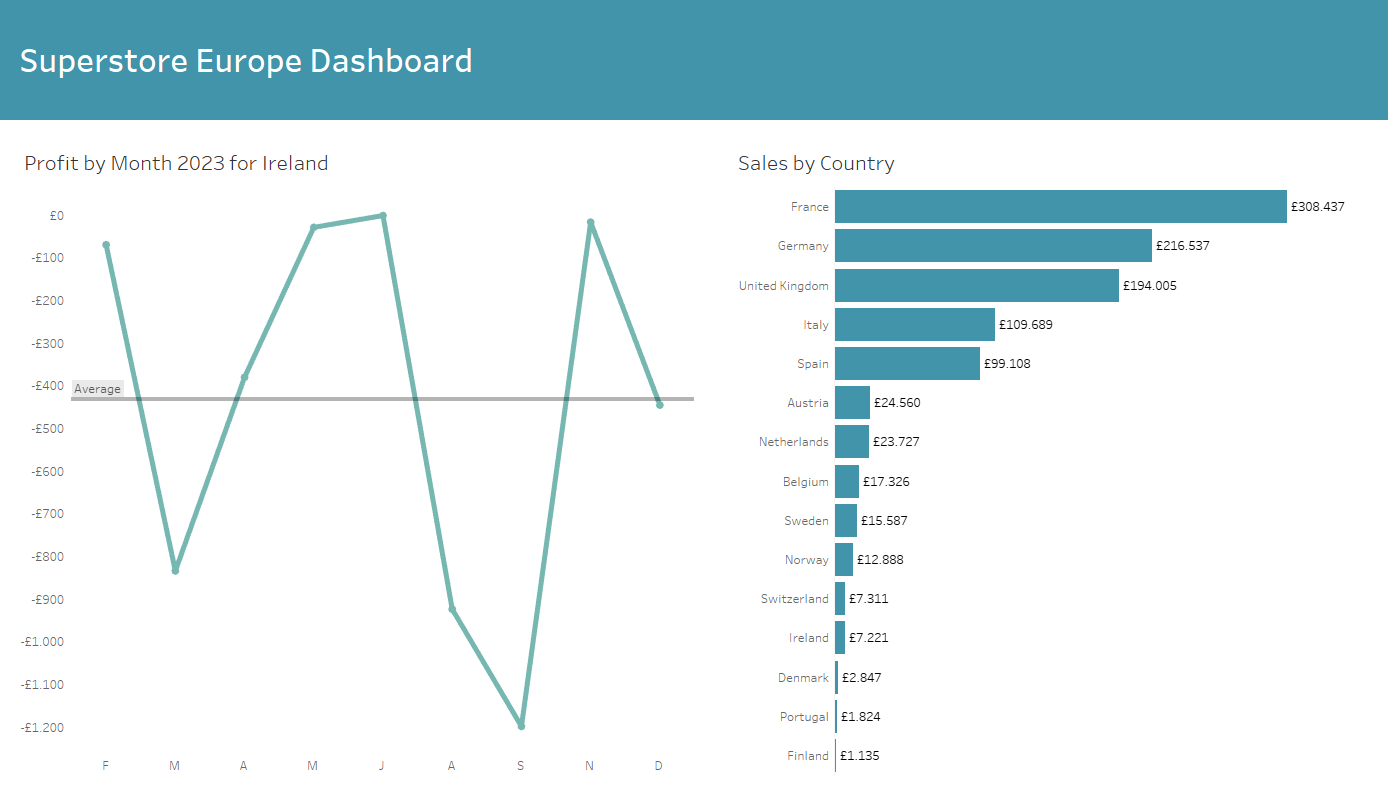
Afterwards we can get started.
Step 1: Create a new Worksheet
The first step is to create a new worksheet for the Apply Button. Name the worksheet Apply Button.
Step 2: Use a Calculated field
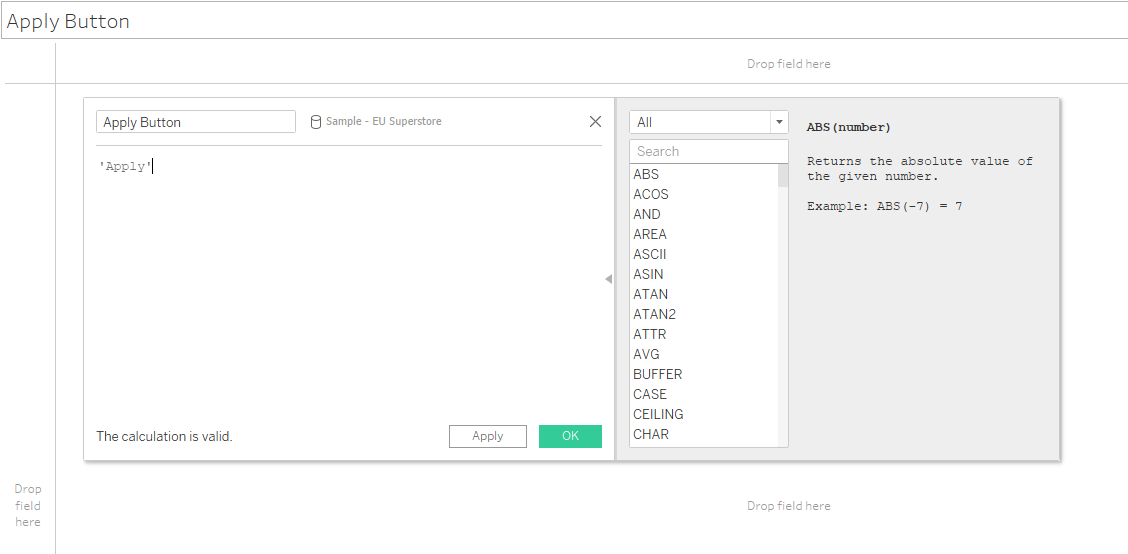
In the second step, you create a new calculated field. Name the field Apply and write the word ‘Apply’ in single inverted commas.
This looks as followed:
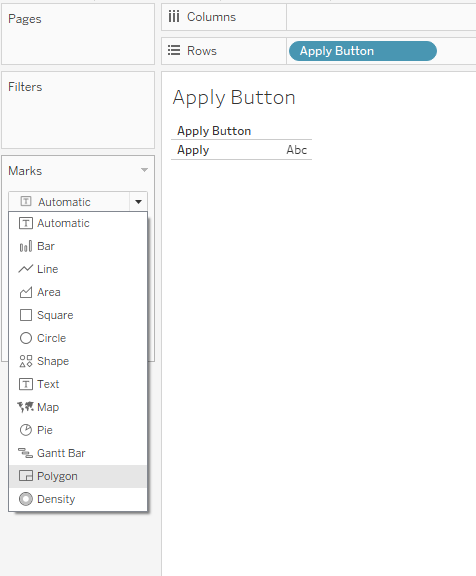
Then place the calculated field in the row shelf and change the seeting to Polygon in the marks space.
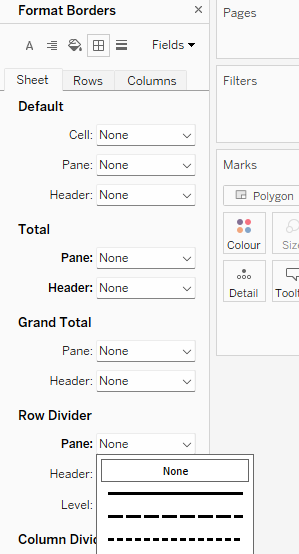
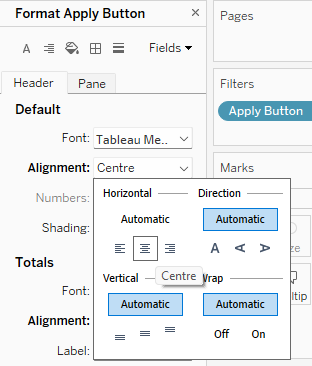
Step 3: Formating
Once the previous steps have been completed, you can customise the button. To do this, you could for example remove the worksheet title and the table header. In addition, the row divider lines can be removed via format adjustments and the text can be placed in the centre. Of course you can add any other formating you need.
Step 4: Put the filter in the Apply Worksheet
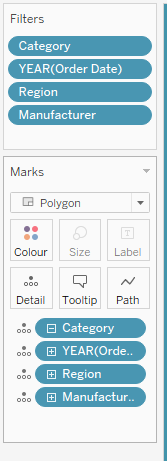
If you have already added the necessary filters in the dashboard you have to remove them. Then go back to the Apply Button Worksheet and put all filters, e.g. year, region, manufactures and category in the filter area and select ‘use all’ in the individual filter menu.
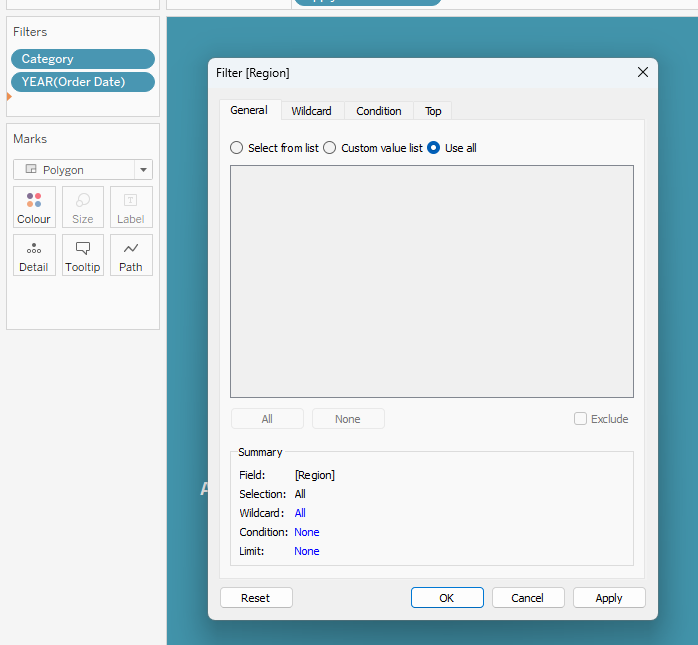
Also bring all filter fields to detail in the marks area.
Step 5: Filter Action
Now you can switch back to the dashboard and place a container above the charts. There you can place the Apply Button worksheet and the connected filters.
This could look something like this:
Afterwards click on dashboard in the Tableau menu bar and select action.
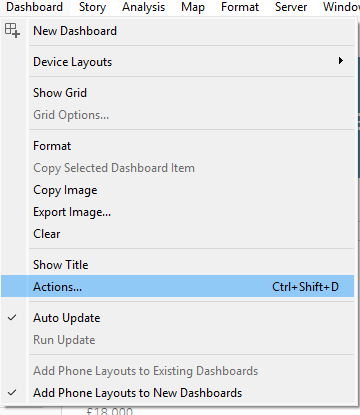
A new menu field will open and then you have to click on add action and choose Filter. The filter action could be named ‘Apply Filter Button’. Then select the Apply worksheet as the source sheet and all other charts as the target sheets. In addition you have to select the filter fields under the selected field area.
Your filter action should look like this:
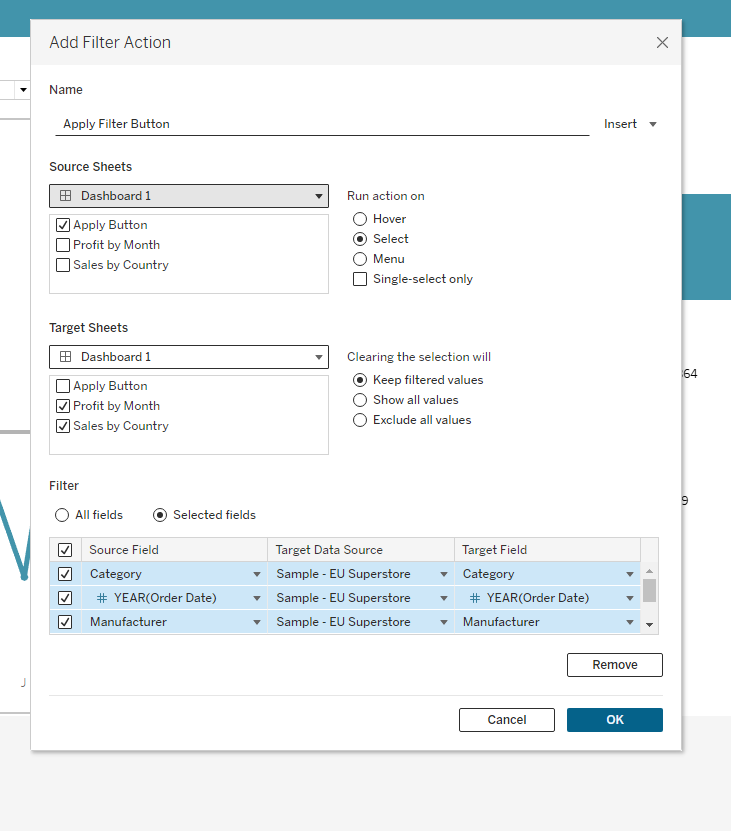
After you checked your settings you can click on ok.
Result:
Now you can set all filters as desired and apply them with the Apply Button. It should work like this:
With a functional Apply Button in place, I'll explain in a follow-up blog how to create a Reset Button in order to clear dashboard from all filters.