


Building on yesterday's progress, today I focused on turning my prepared data and dashboard plans into actual Tableau visualizations.
Executive Dashboard
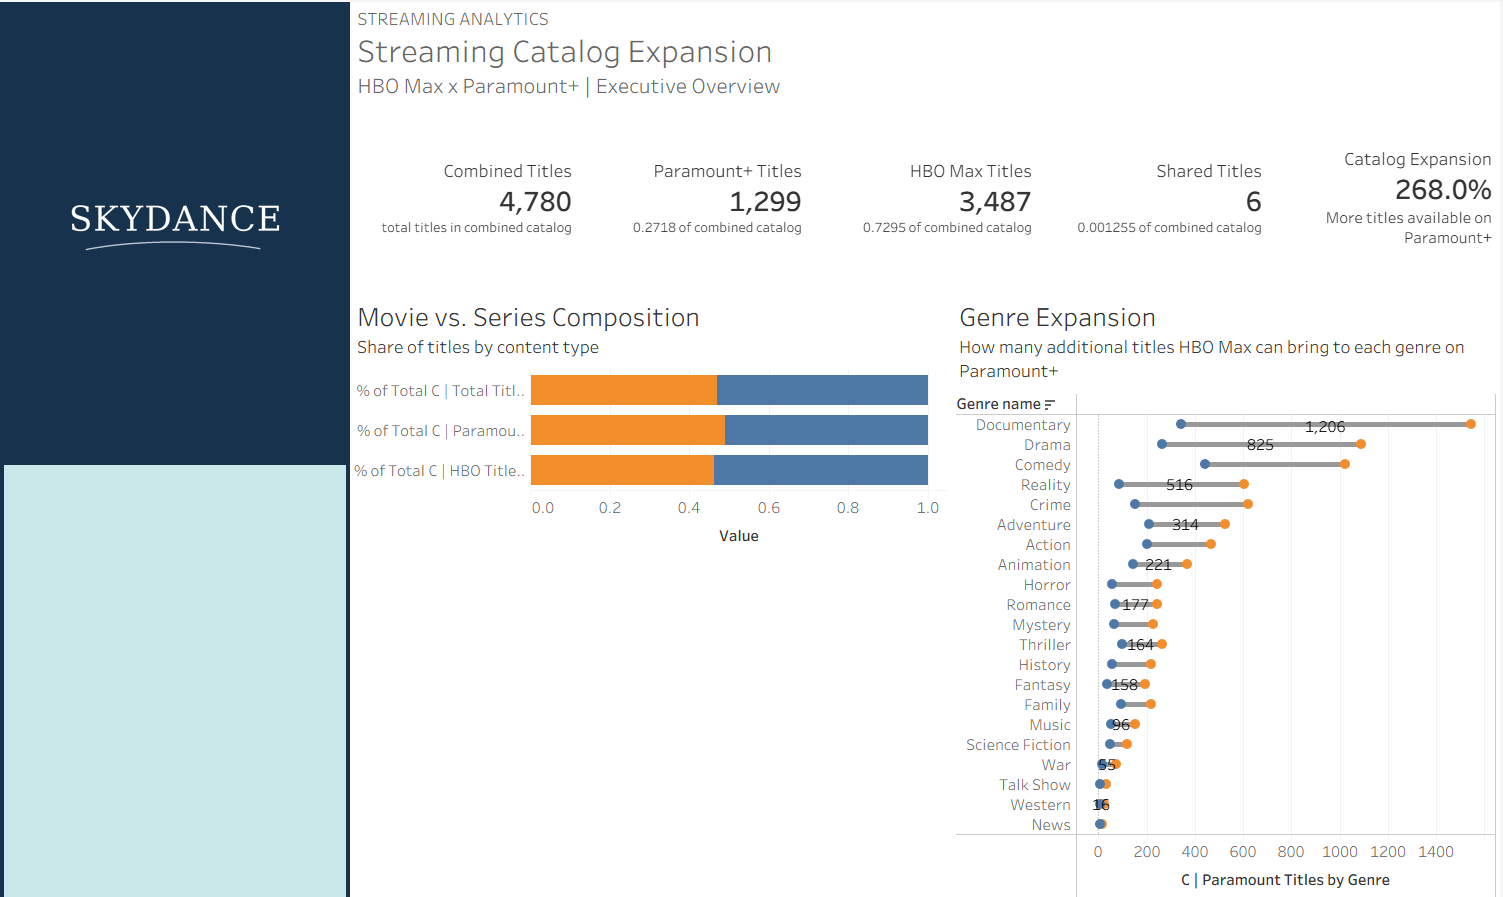
I spent the first part of the day building out my Executive Overview, which focuses on how combining HBO Max and Paramount+ could expand the existing streaming catalog. I developed five KPIs alongside visualizations comparing movie and series composition and genre expansion.
The dashboard is getting close to finished, with some final formatting and adjustments remaining.
Analyst Dashboard
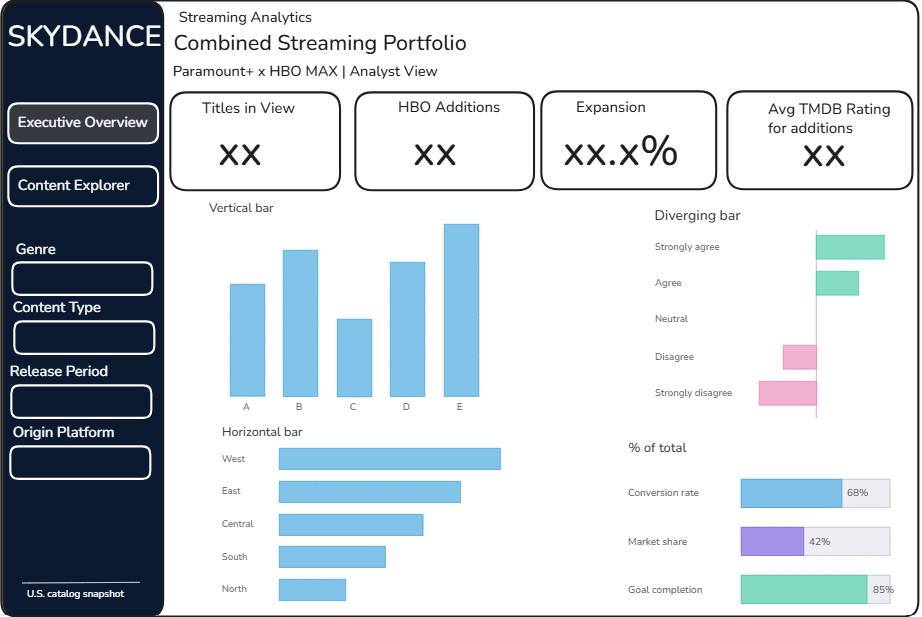
Next, I sketched out my Analyst Overview, designed to explore the individual titles and content opportunities behind the executive findings.
I began developing several visualizations analyzing TMDB rating distributions, rating differences by genre, release periods, and standout titles. These will help analysts investigate how HBO Max's content compares with Paramount+'s existing catalog.
Calculated Fields
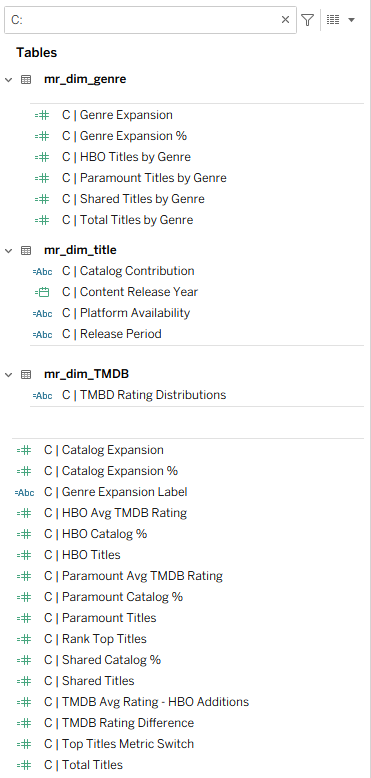
Throughout the dashboard development process, I also created and refined several calculated fields to ensure consistency across my analyses.
These calculations were particularly important for distinguishing Paramount+'s existing catalog from HBO Max's additional titles, measuring catalog expansion, and comparing content across genres. I also developed calculations for TMDB ratings and dynamic metric selection to support the Analyst Dashboard.
Keeping these calculations organized helped me reuse metrics across multiple visualizations while maintaining consistency in my analysis.
Looking Ahead to Day 5
Tomorrow, I'll focus on finalizing the Analyst Dashboard, polishing the formatting and design across both dashboards, and preparing my final presentation to communicate the project's process, findings, and key takeaways.
Thanks for reading, and stay tuned for Day 5!