


Hierarchies and groupings in Tableau are powerful tools to structure your data and create interactive dashboards. They allow you to analyze information efficiently without requiring complex calculations or additional data preparation. In this blog, I’ll explain how to create them, the benefits they offer, and provide practical examples of their use.
What Are Hierarchies in Tableau?
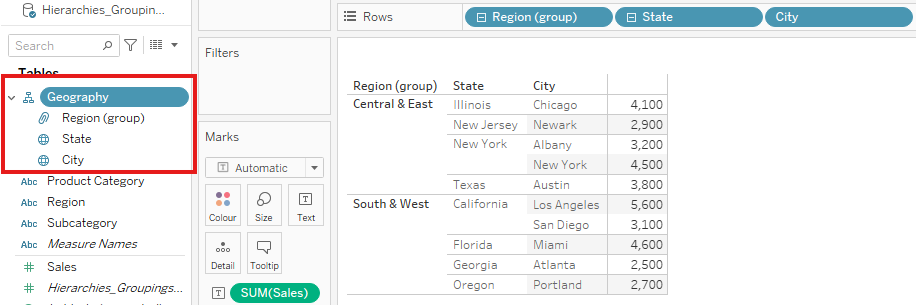
Hierarchies allow you to represent data in a tree structure. They help establish relationships between different dimensions, such as “Region > State > City” or “Product Category > Subcategory > Product.”
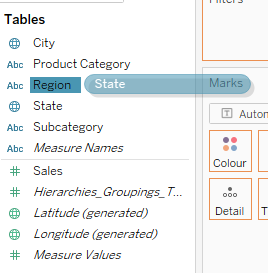
How to Create a Hierarchy?
- Drag one dimension from the data pane (e.g., “State”) onto another dimension (e.g., “Region”).
- Tableau will ask: “Create Hierarchy” .
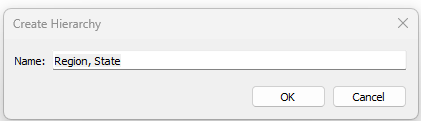
- Rename the hierarchy if needed (e.g., “Geography”).
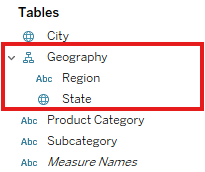
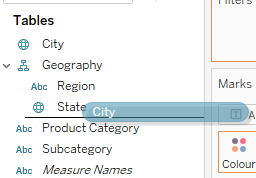
If you want another dimension in teh hierarchy, drag the dimension to the reasonable position in the hierarchy.
Benefits of Hierarchies
- Drill-Down Functionality: Enables users to navigate from aggregated data to more detailed levels.
- Improved Organization: Structured navigation between data levels.
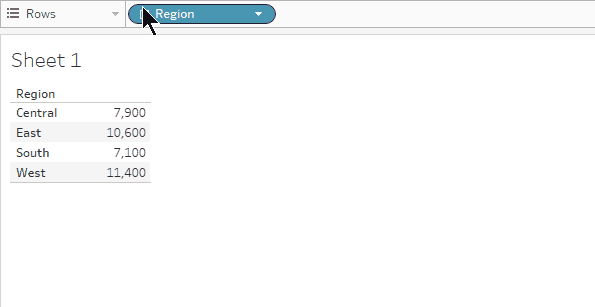
Use Case: In a sales report, you can "zoom in" from regional views to individual cities to better understand regional differences.
What Are Groupings in Tableau?
Groupings allow you to combine multiple values in a dimension into a custom group. For instance, you can group product categories like "Books" and "Magazines" into "Stationery."
How to Create a Group?
- Right-click on the dimension in the data pane and select “Create” > “Group.”
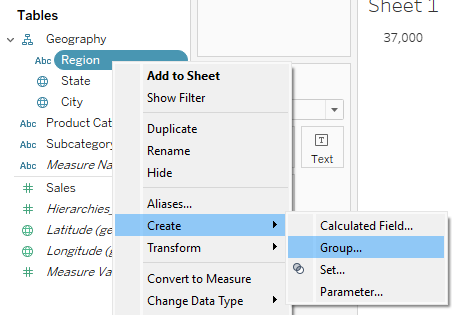
- Select the values you want to group (e.g., Region) and click “Group.”
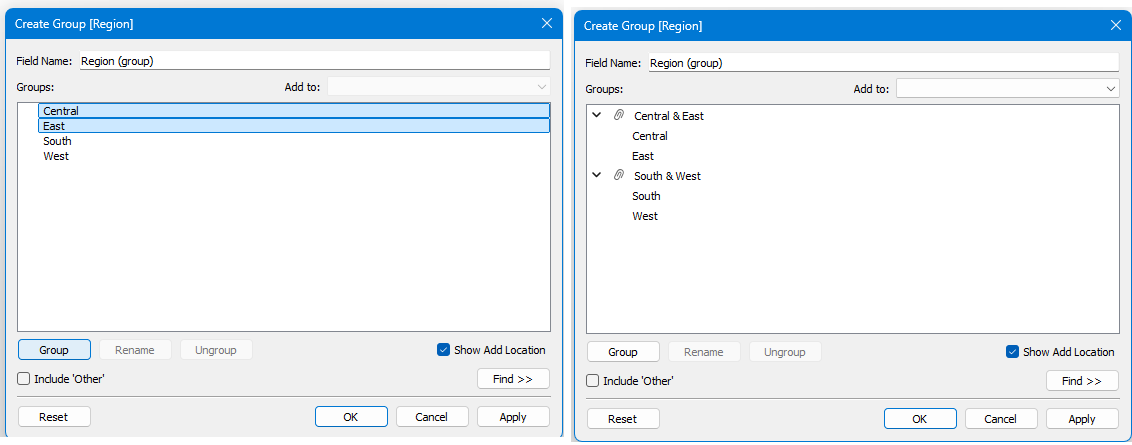
- Rename the group if needed.
Benefits of Groupings
- Flexibility: Analyze categories that don’t exist in the raw data.
- Focus on Key Groups: Reduce complexity by combining similar values.
Conclusion: Hierarchies and groupings in Tableau help structure your data and make it more intuitive to analyze. They enhance the usability of your dashboards and provide clear insights into complex datasets. Use these features to make your analyses even more impactful!