


Filters are a cornerstone of Tableau dashboards, giving users control over the data they see. Tableau offers various filter types and display options designed specifically for dashboards. In this blog, we’ll explore the key filter types and how they can be visually integrated into dashboards to enhance user interactivity.
1. Category Filters
Category filters are perfect for filtering discrete values like regions, product categories or customer segments.
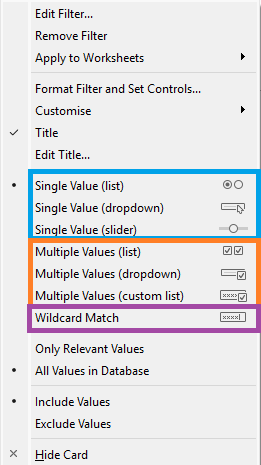
Display Options:
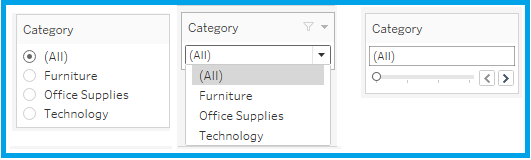
- Single Value: Users can select only one value at a time.
- Multiple Value: Allows users to select multiple categories simultaneously.
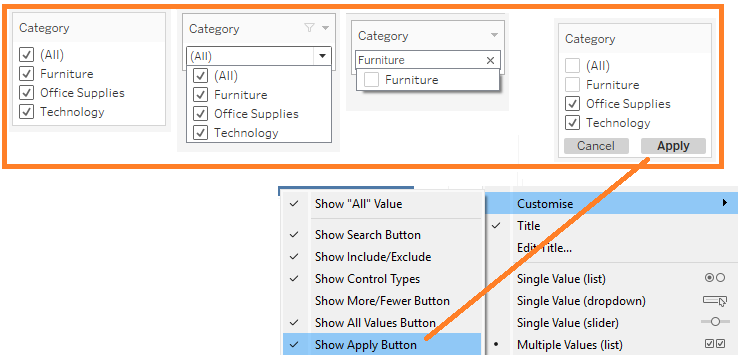
If you use Mutiple Value and have many values, show the Apply Button for a better performance. Otherwise, each time a filter argument is selected, the data set is filtered before all filter arguments have been selected.
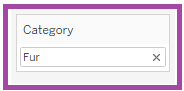
- Wildcard: Users can write a part of the selection.
- Checkboxes: Intuitive and ideal for a small number of categories.
- Dropdown Menu: A space-saving option, especially useful for many categories.
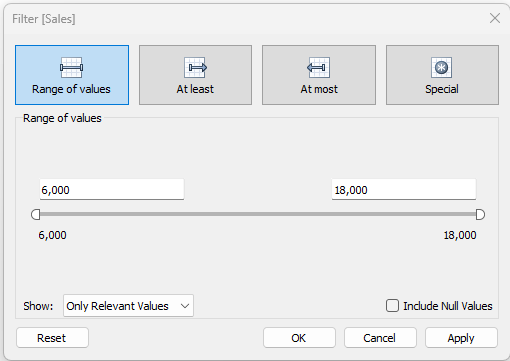
2. Measure Filters
Measure filters are used to filter data based on numerical values, such as sales or profit.
Display Options:
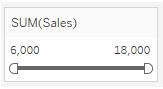
Range:
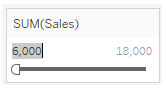
At least:
At most:
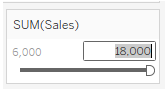
- Slider: Users can define a range, e.g., “Sales between 10,000 and 50,000.”
- Input Fields: Allow precise entry of minimum and maximum values.
3. Date Filters
Date filters are essential for slicing data by time.
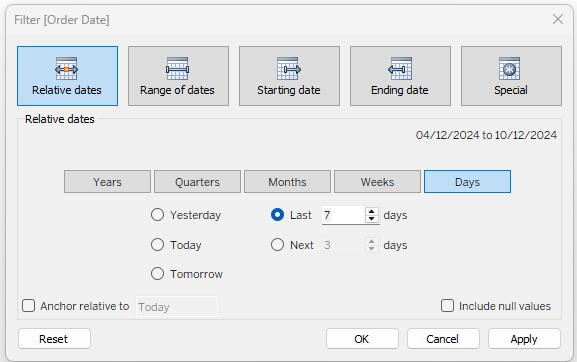
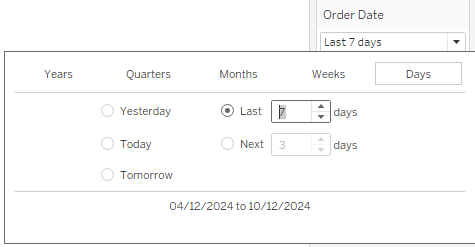
Display Options:
- Relative Date Filter: Allows users to filter for periods like “Last 7 days” or “Last 3 months.”
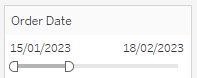
- Range Filter: A slider to select a specific date range.
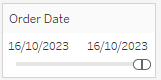
- Single Date: Users pick an exact date.
Conclusion
Filters in Tableau dashboards are highly versatile and customizable. You can choose not only the filter type (category, date, measure) but also its display style (dropdown, slider, checkboxes) to provide an optimal user experience. Experiment with different combinations to make your dashboards more interactive and impactful.
Pro Tip: Always test your filter settings in the preview mode to ensure they are intuitive for users.