In this blog, I describe my approach to my personal project. The task was to come up with a personal project to visualise data that is important to me.
Project idea: As I worked on a cruise ship for almost 10 years and have seen a lot of the world, I wanted to create a map with all the harbours I have visited. Additional some popular routes and places of interest Eastereggs 😉
First I downloaded my data from Google Maps. I was emailed a JSON file with the saved data. I checked my dataset and found that there are many other private favourites, so I will create a new dataset with the destination ports. I use Google, ChatGPT and Perplexity to search for cruise itineraries, popular itineraries and the most popular cruise ports. But that was not so successful.
Changing my workflow, I used ChatGPT to find all cruise ship ports in the world with longitude and latitude, annual visitors and main attractions. the google maps data was not directly usable data. ChatGPT has also created a current itinerary in a spreadsheet that I can work with for now.

With ChatGPT I found more and more cruise ports around the world and they were added to my dataset. I also found POIs - points of interest.
Next step: inport the dataset to Tableau desktop.
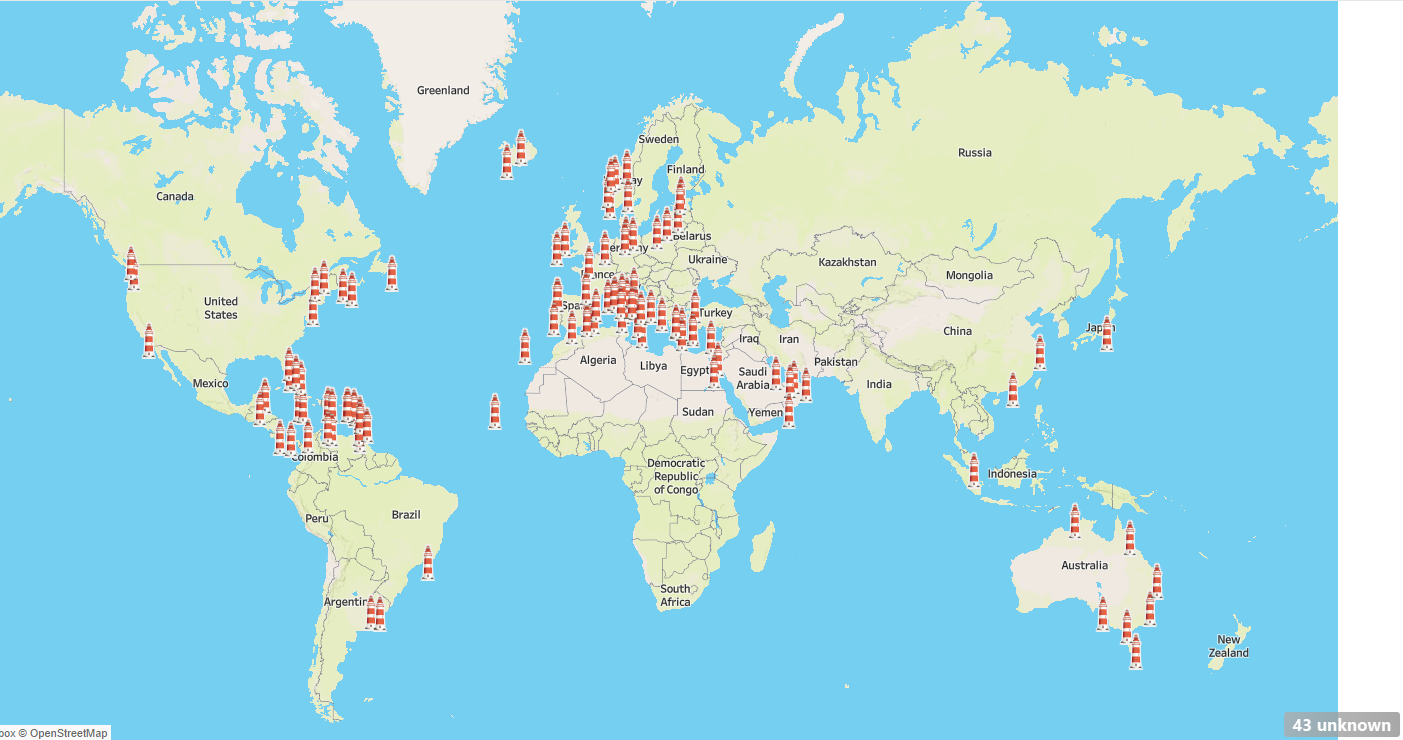
This is the map with the cruise ship ports marked with a lighthouse.
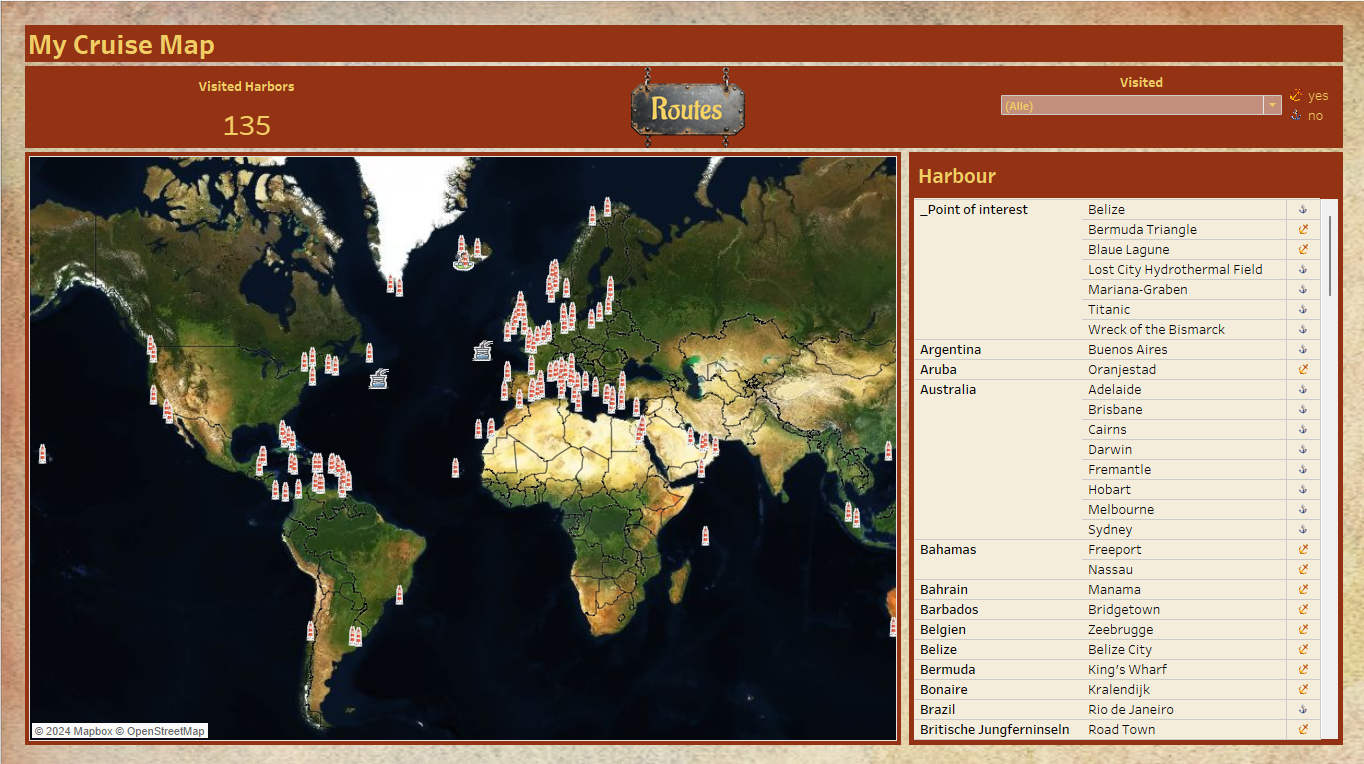
Time for the first dashboard:
- create teh dashboard design with a background picture
- placed header
- filter for visited harbor yes/no
- KPI for visited habors
- with all harbors and POI´s
- special icons for the POI´s
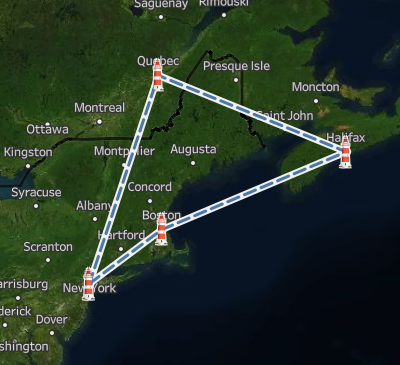
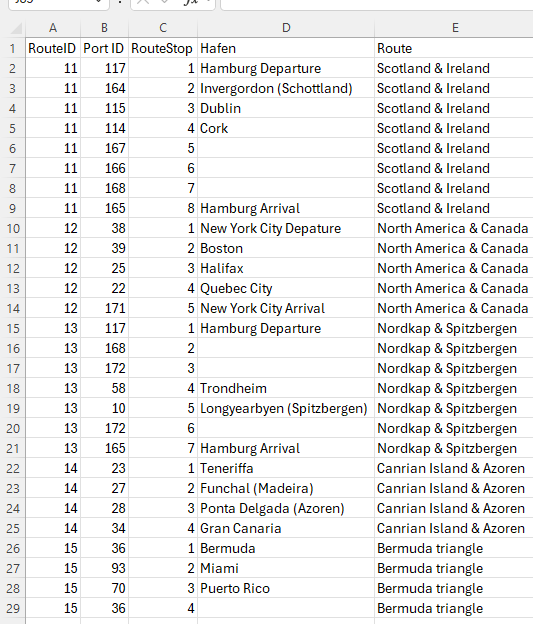
The next dashboard will display various cruise routes. I have created another Excel table with the routes, the individual ports on the route and the order of the ports on the routes. I noticed that the individual ports are of course directly connected to each other. That's why I added additional route points to make the route look more realistic.
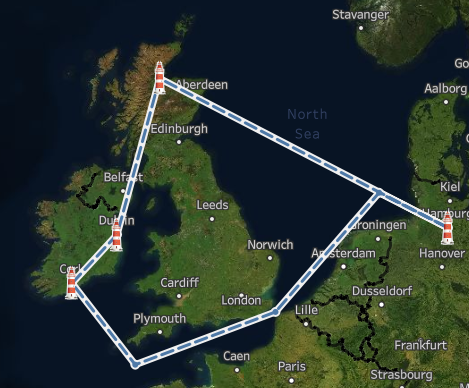
I have also created a start dashboard to make it more interesting. I have linked the individual dashboards via navigation buttons.
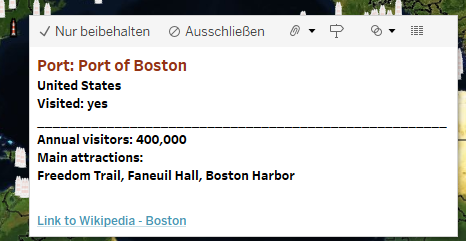
In the tool tip for the individual harbours I have added a link to the respective city/POI on Wikipedia.
My personal project is not over yet. There is still a lot to do.
- more routes and intermediate stops
- more POI's and hidden Eastereggs
- Ship horn sound
Or maybe you have another great idea for me!
Here the link to my personal project on Tableau public:
https://public.tableau.com/app/profile/marcus.oberdiek/viz/My_Cruise_Map/CruiseMapIntro
