Power BI is a powerful tool for data visualization and analysis. One of the most useful features that Power BI offers is bookmarks. Bookmarks allow users to save specific views of their reports and retrieve them later. In this blog post, I will explain how to create, edit and use bookmarks, as well as highlight the benefits of this feature.
Creation of bookmarks

Prepare view: Make sure your report is in the desired view. This includes filters, sorting and visible visualizations.
Add bookmark: Go to the “View” tab and click on “Bookmarks”. Select “Add”. A new bookmark will be created and displayed in the bookmarks bar.
Rename: Give your bookmark a meaningful name so that you can easily identify it later.

Insert a bookmark button
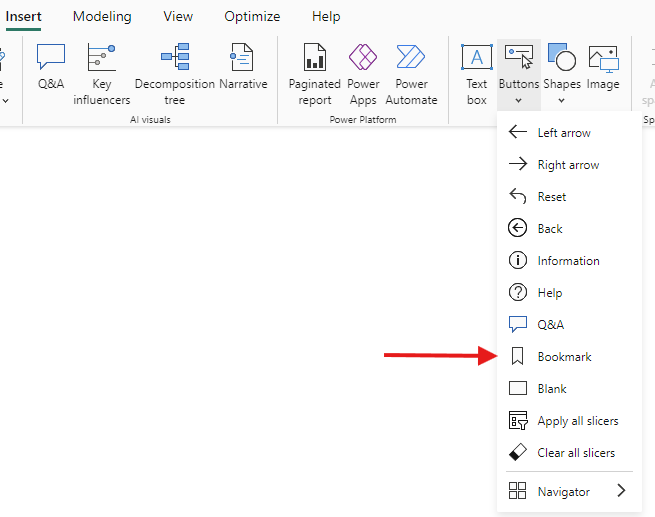
Go to the "Insert" tab -"Buttons" and choose "Bookmark"

You will see the Boolmark Button on your page and the "Format button" column on the right side. Here you can format and style the button. With "Action" choose the Bookmark from the list.

Click on the Bookmark button and the filters on this page will be set to back to the saved settings. It is also possible to jump to another page with preselected settings.
Update bookmarks
Select bookmark: Click on the bookmark to be edited in the bookmarks bar.
Make changes: Customize the view of the report as needed.
Update bookmark: Right-click on the bookmark and select “Update” to save the changes.
Advantages of bookmarks
Time saving: Bookmarks allow you to quickly return to certain views without having to reset the filters and visualizations each time.
Interactivity: By combining bookmarks with other Power BI features, you can create interactive and user-friendly reports.
Flexibility: Bookmarks provide a flexible way to store and retrieve different scenarios and analyses within a single report.
Conclusion
Bookmarks are an indispensable tool in Power BI that can significantly increase the efficiency and user-friendliness of your reports. By creating, editing and using bookmarks in a targeted manner, you can optimize your data analysis and create impressive, interactive reports.
