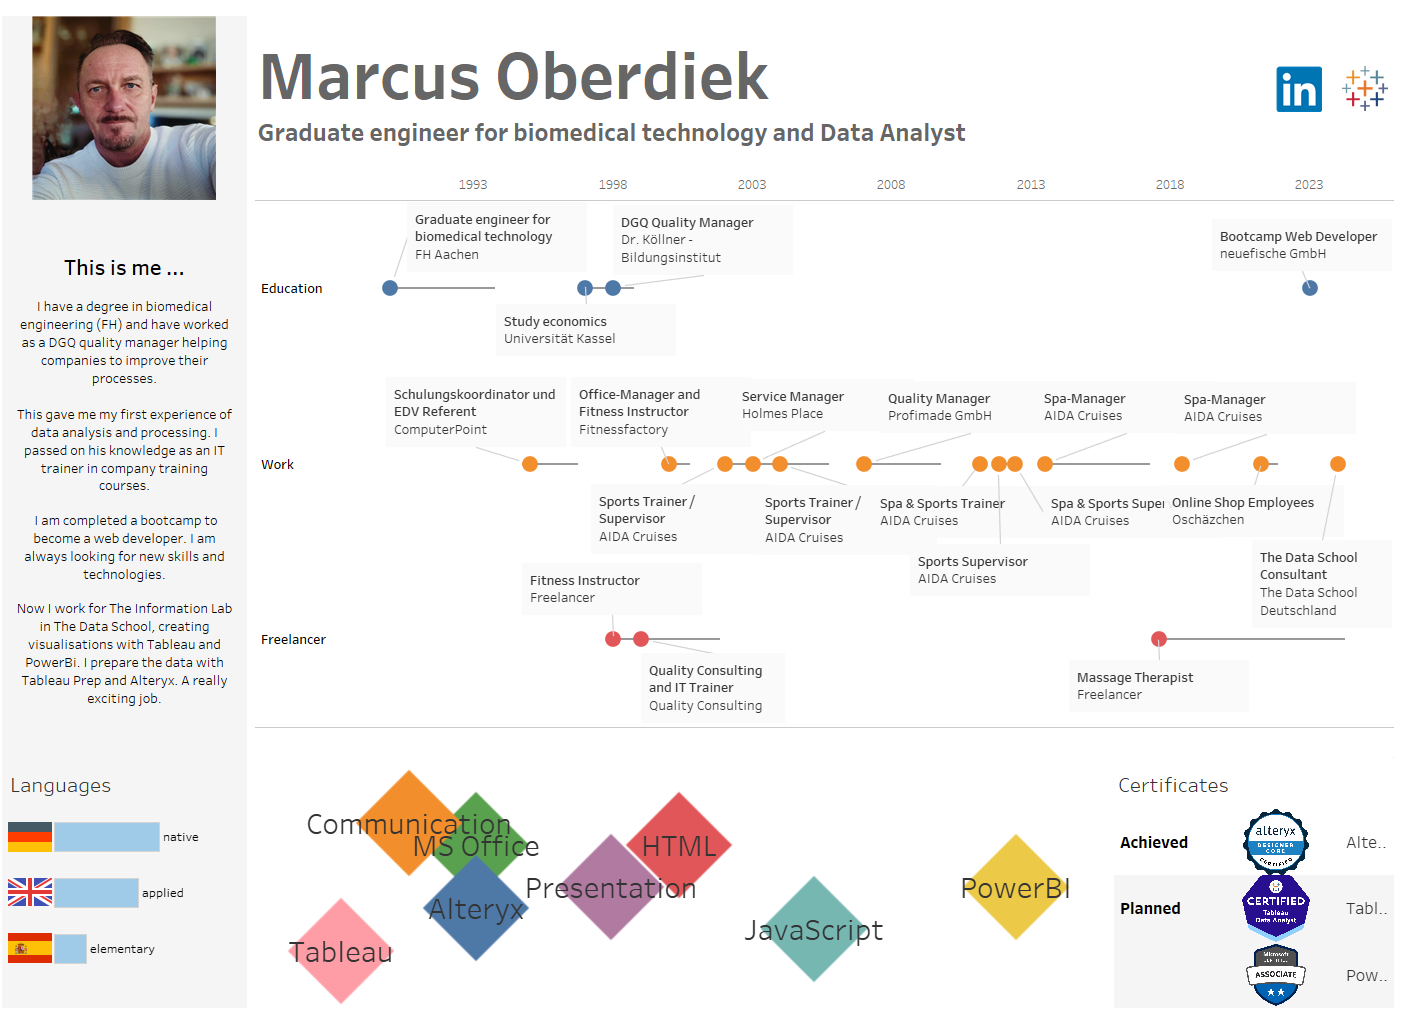
Create a CV in Tableau Desktop
The last week of the 4 month training at The Data School! And as always, it ends with Dashboard Week.
Task: Create your CV in Tableau Desktop.
First of all, I thought about where I would get all the data from. Research everything and write it down again? No! Everything is already in my LinkedIN profile. So export the entire CV and then import it into Excel and all the data is available.

I sorted all the data, created various sheets and prepared them manually.
I used Tableau public to get inspiration on which visualisations I liked.
I found 2 dashboards that inspired me:
Here was it the timeline.
And here are the honeycombs for my skills.
Then I created a sketch of what my dashboard should look like.

And off we went with Tableau. I imported the Excel into Tableau and started creating the timeline. I created a Gantt chart with a Dual Axis with Circle Chart. To do this, I created a calculated field that calculates the duration of the activity.
I have included the company logo in the tooltip. As a shape for the company.
My language skills have been labelled with a flag.
I used shapes and coordinates to display my other skills. Not all skills are included, there are still some to come. First of all SQL!
My achieved and planned certificates are shown with logo.
The LinkedIN and Tableau public logos at the top still need to be linked.
I was very surprised how much you can do in such a short time 😀

