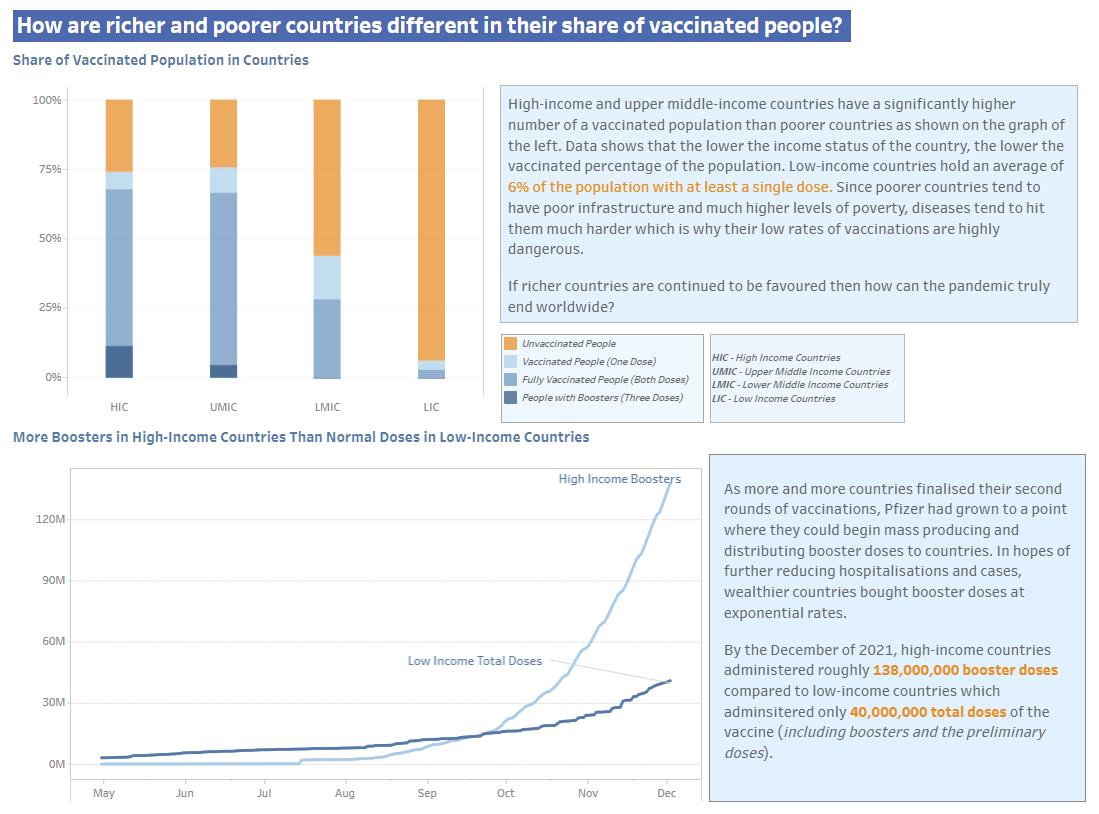
Some time around December 2021, I applied to the Data School with this viz:
https://public.tableau.com/app/profile/marcelo.ramos4035/viz/TheInequalityofCoVaxv2/Dashboard1
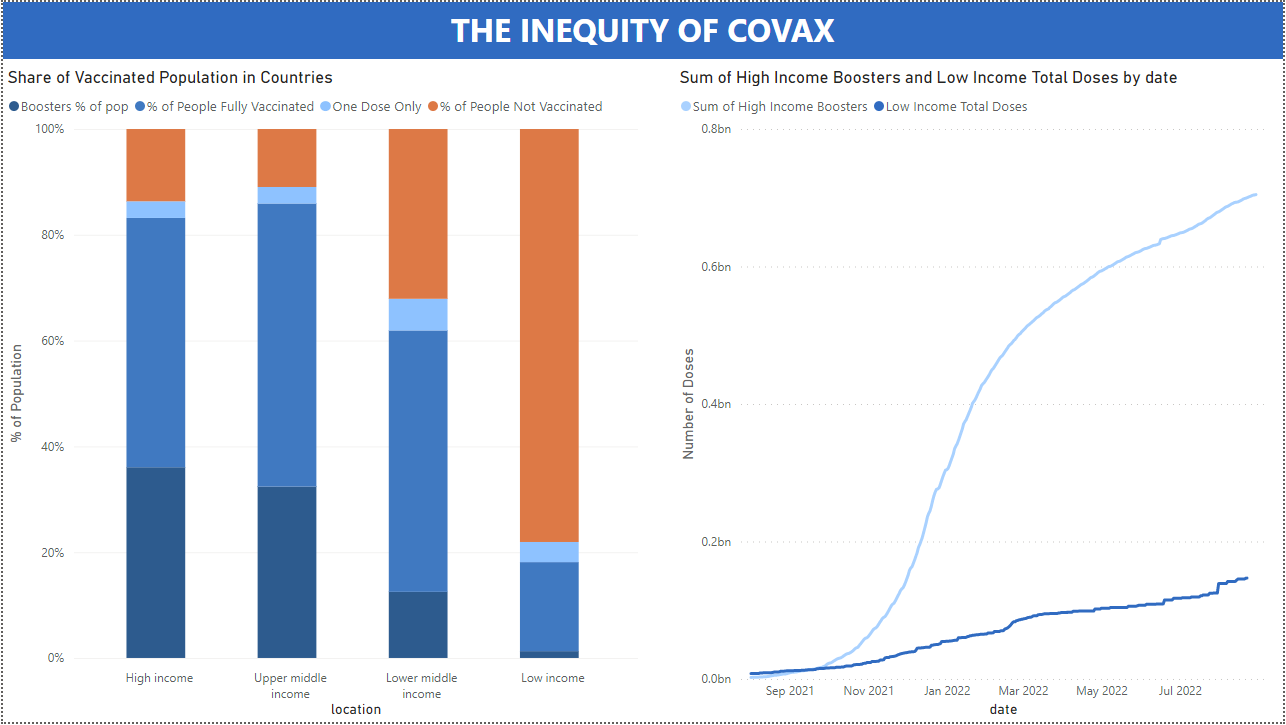
Fast-forward to today, I'm sitting in the Green room of the TIL building learning to use PowerBI for the first time. Within the lesson, my challenge I set myself was to try to reproduce that application I first applied to the DS with.
Firstly, I'll begin by saying that it took me a while to get the hang of PowerBI but after a while I got around to creating a chart and realised that it isn't as intuitive as Tableau. For example, Tableau is a lot more "clickable", and by this I mean you can double click the Title of the sheet and edit it, or double click a legend and edit it. However, on PowerBI you have to dig into the menus a bit more but once you find it out, it's fairly simple to remember and repeat it.
The chart selection on PowerBI is actually quite nice. You don't have to build a chart as you do on Tableau , instead it's like the "Show Me" section on Tableau but instead it places the chart on the dashboard and allows you to input the fields you like. However, it doesn't teach you which kinds of fields should be inputted or how the data should be structured.
In the end, I only made 2 charts. For these charts, I had to make calculated fields which were a tiny bit different to Tableau, but in the end it was basically the same thing. I was quite impressed by PowerBI's options of charts, especially within the 'get more visuals' section where it is basically a repository of community-created chart templates that you can use such as a Radar chart which is quite difficult to make within Tableau.
Below are both parts of the dashboards from both Tableau & Alteryx and they almost identical. Tableau is much better at a design aspect, it feels a lot more customisable but I've only used PowerBI for half a day so I don't want to make too many assumptions.