Do you want to find the biggest outliers in your view on your Tableau Worksheet? Calculating z-scores will allow you to find how many standard deviations away from the mean your values are, and in turn show you those that are the furthest away from the mean.
What is a z-score? A z-score is a measurement that describes the relationship between a value and the mean of a group of values. If a z-score is 0 then the data point is identical to the group's mean. It standardizes data to also allow better comparability in how much of an outlier it is compared to its group.
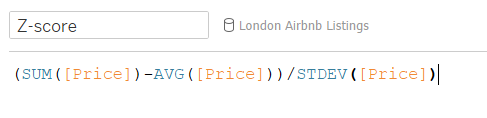
Calculating this on Tableau is simple and only requires a single calculation if you want a z-score in respect to the entire dataset.

Z = standard score x = observed value µ = mean of sample
σ = standard deviation