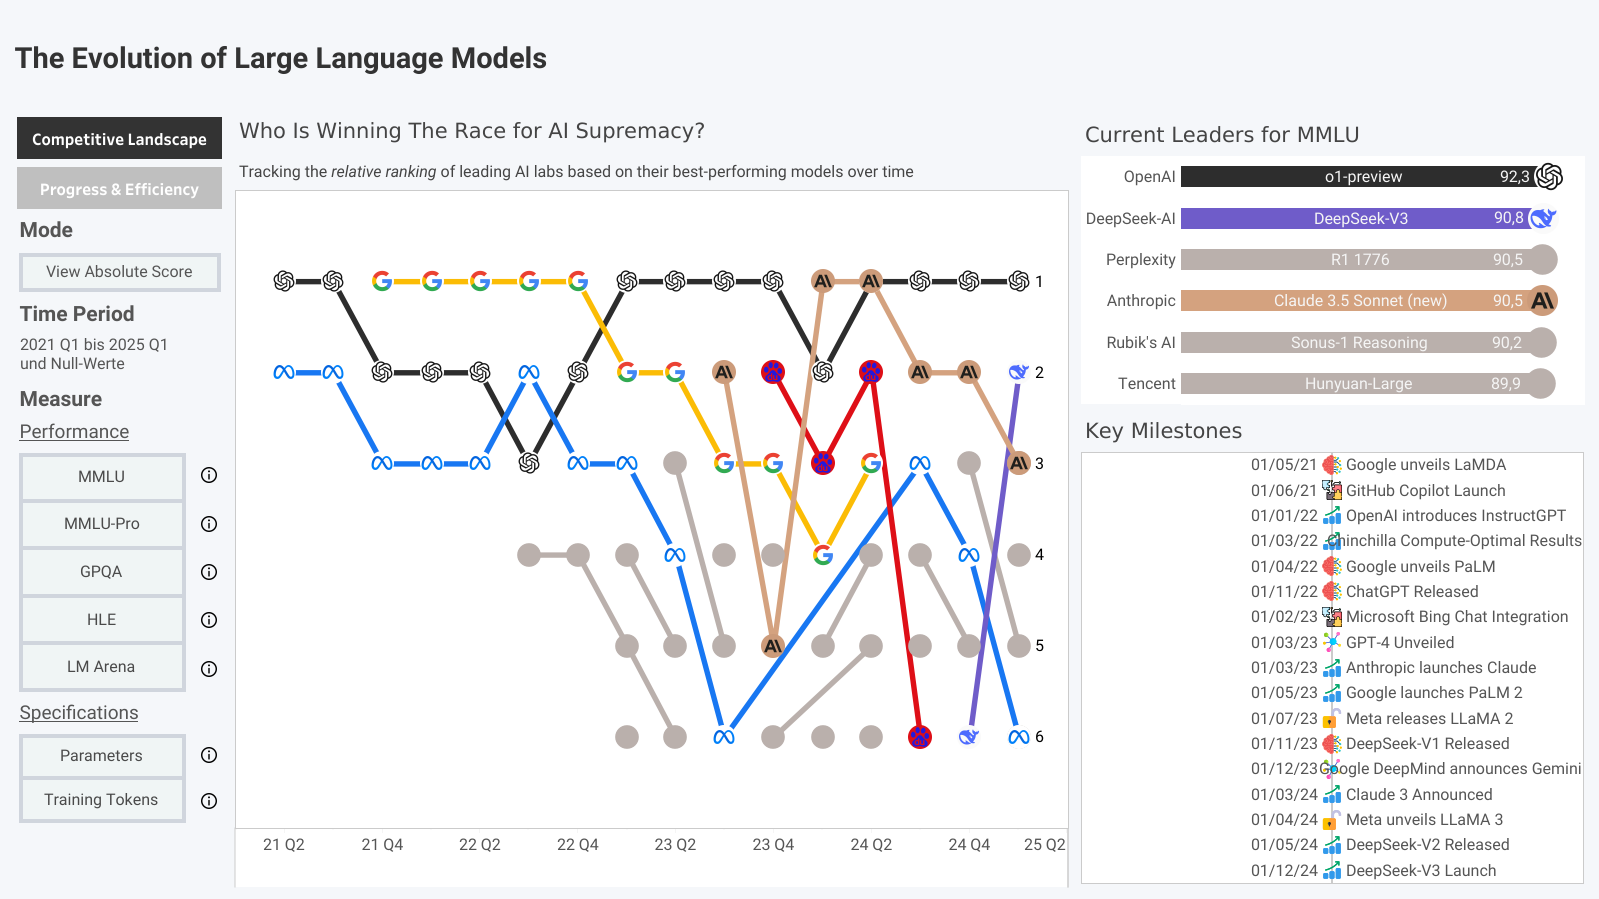
The time has come - the final day of Dashboard Week and the culmination of our entire Data School training! For this grand finale, I decided to dive into the fascinating world of Large Language Models and visualise the intense competition between AI labs that's reshaping our technological landscape.
The Challenge
My goal was to create a dashboard that visualises the competitive landscape between AI labs, showing how models like GPT-4, Claude, and Gemini have progressed over time in various benchmarks. The biggest technical challenge was creating a continuous timeline for each lab, as models are released irregularly but their capabilities persist.
Data Preparation
Using Alteryx, I built a workflow that:
- Combined and enriched data from multiple sources:
- Google Sheet Data from LifeArchitect.ai for the most up-to-date model information
- Google Sheet Data used for Information is Beautiful's LLM visualization for additional performance metrics and LM Arena data
- Scaffolding the data by creating a complete date spine covering all time periods
- Implemented a "carry forward" calculation to maintain each lab's best score until a new model was released
- Generated rankings for each time point based on multiple performance metrics

The Final Dashboard

The dashboard focuses on the "race for AI supremacy" with a bump chart as the central elements that tracks each lab's ranking over time. Users can:
- Switch between different benchmarks (MMLU, MMLU-Pro, GPQA, etc.)
- Toggle between ranking view and absolute scores
- See current leaders and key milestones in the industry (hovering over them highlights the relevant date and lab in the bump chart)
This project involved significant editorial decisions about which stories to highlight. I deliberately chose to emphasise certain labs (OpenAI, Google, Anthropic, DeepSeek) with distinct colors and branding because they represented the most compelling narratives in the data, while relegating others to the background as grey lines (their details can still be seen through details by hovering over them). Similarly, the milestone timeline represents a curated selection of events I judged to be pivotal moments in LLM development, shaping how users interpret the competitive landscape.
