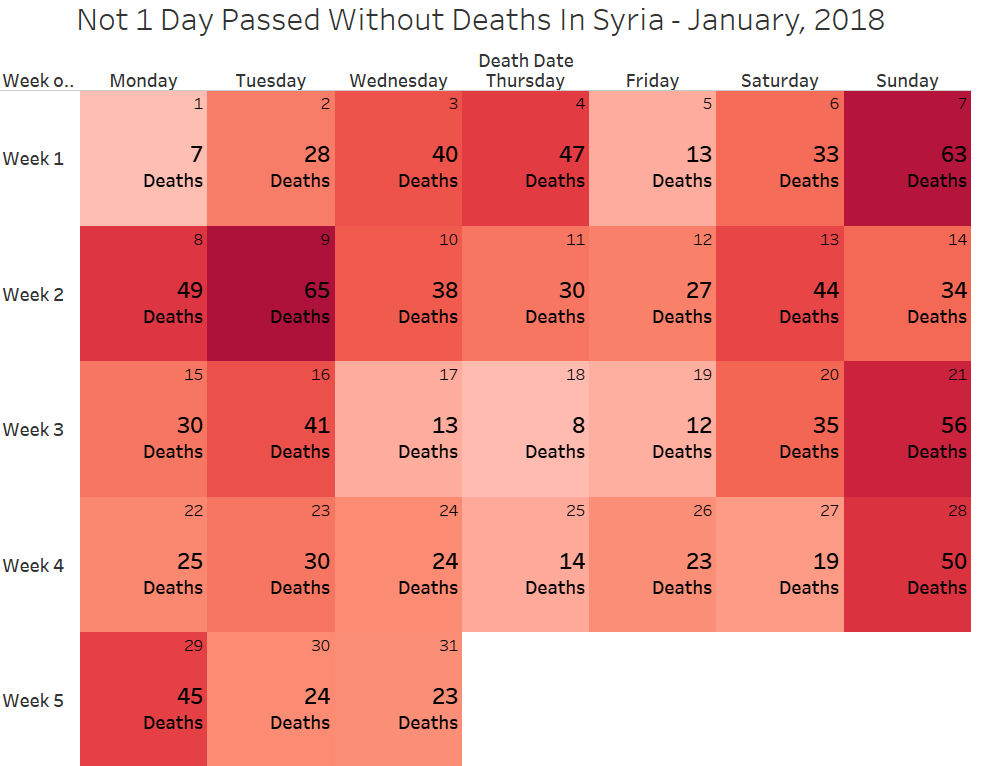
Using a Calendar chart can be an impactful way to showcase information for a particular month in a view.
All dates used for this graph will be discrete.
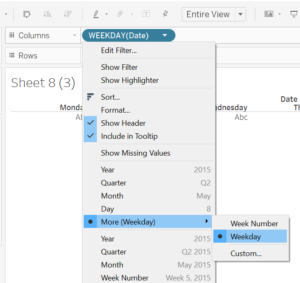
- Drag Date into Columns. Then turn Date type into weekday (discrete).
- Then again drag date, this time into the Rows shelf and set it as Week Number.
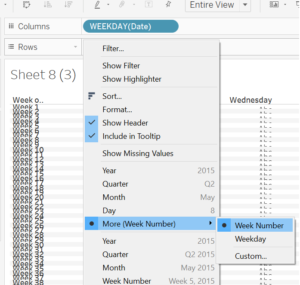
This should result in every week number within your dataset to show.
3.Filter to which Date to which month you would like to view.
*Tip: Drag Date onto the filters shelf. Click on Month/Year to easily pick which specific month you to view. 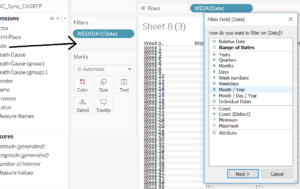
You should end up with something like this: 
Now it’s time to add your detail into view. If you would like to view each date into view add Date into the Text on your Marks Card.
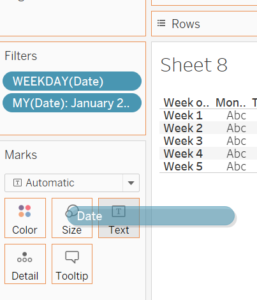
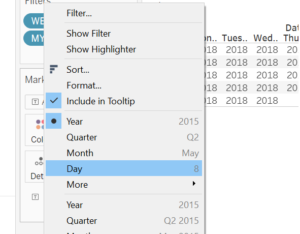
Then turn Date into Day (discrete).
Adjust the view into Entire Screen and realign your Text on the Text Shelf. The result should look like this.
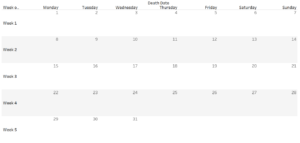
After this you can start to display the information within those dates you would like to and also change the colour of each date’s box in relation to your information.
*Example: Add your choice of information into Text and on to Colour.
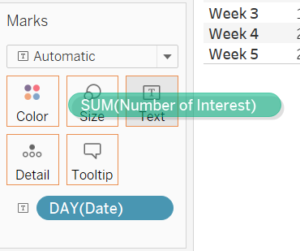
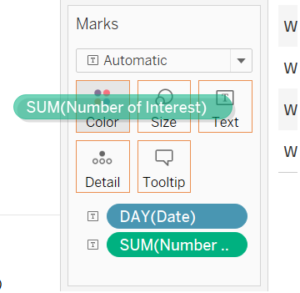
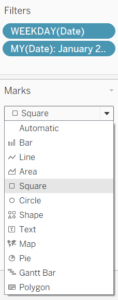
On the Marks Card, set automatic view into squares. This will result in each calendar Date square being changed depending on the information provided. Which you will be able to change, by clicking on to the colour shelf.
Now you can edit the Text within the box to show your information as you wish. From the Text Shelf in your Marks Card.
My example:
