


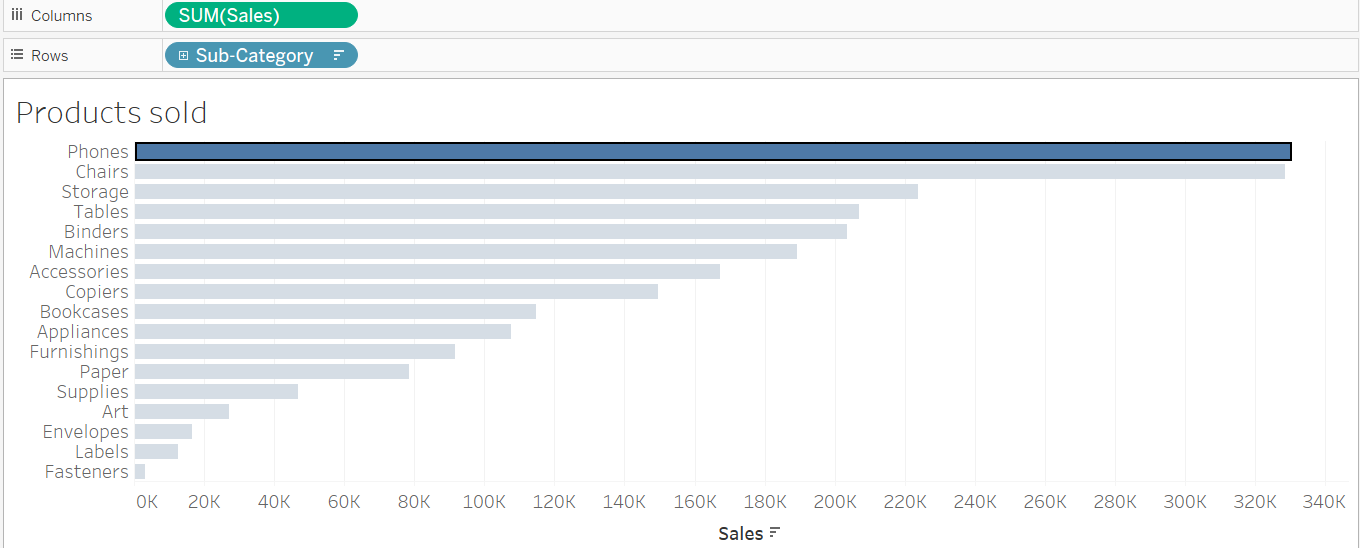
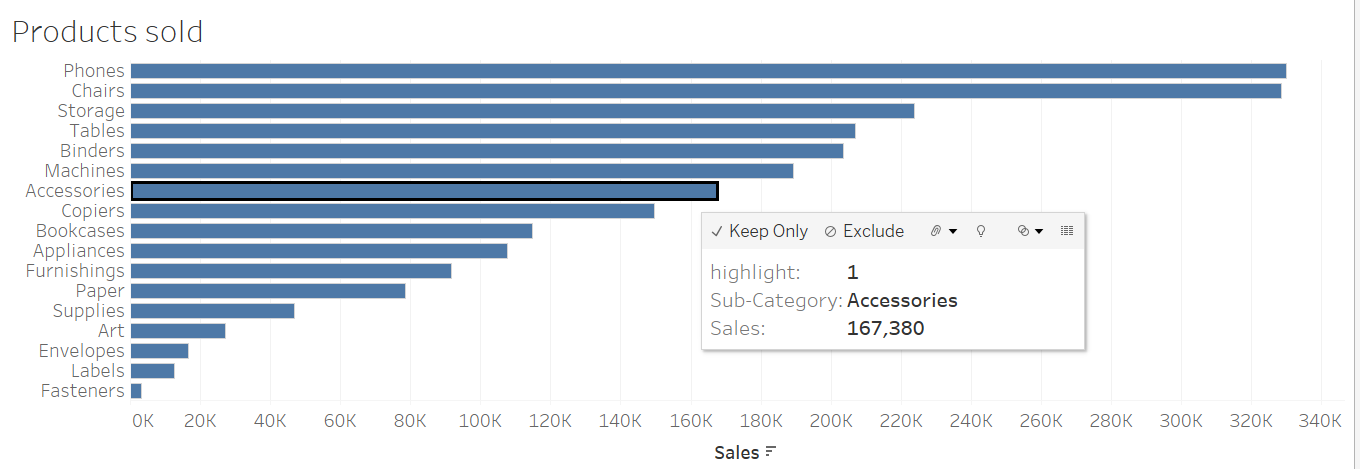
When you create graphs in tableau and click on a selected field, everything else turns grey. (See example below)
If you want to turn that off, there are multiple ways to do this.
(Personally think method 2 is easier & quicker)
This bit is the same for both
- Create a new calculated field and put anything random in it. (If you use a string make sure you set quotation around it for example; "hi")
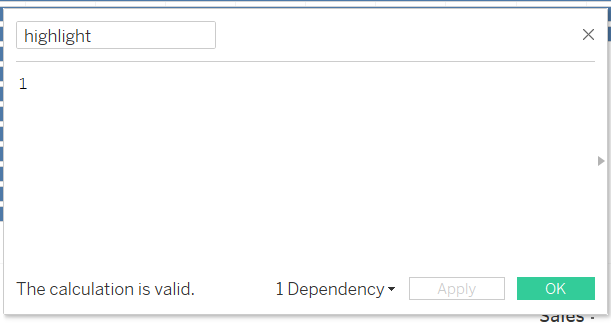
- It will give it to you as a measure (green). You will have to drag it up into the dimensions pane (blue).
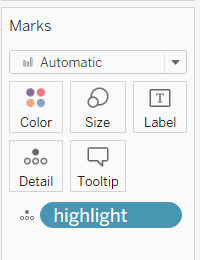
- Now its blue, place the highlight field into details in the marks pane
Method 1:
- Click Shift + Ctrl +A to open up the actions page
- Select This Sheet -> Add Action -> Highlight
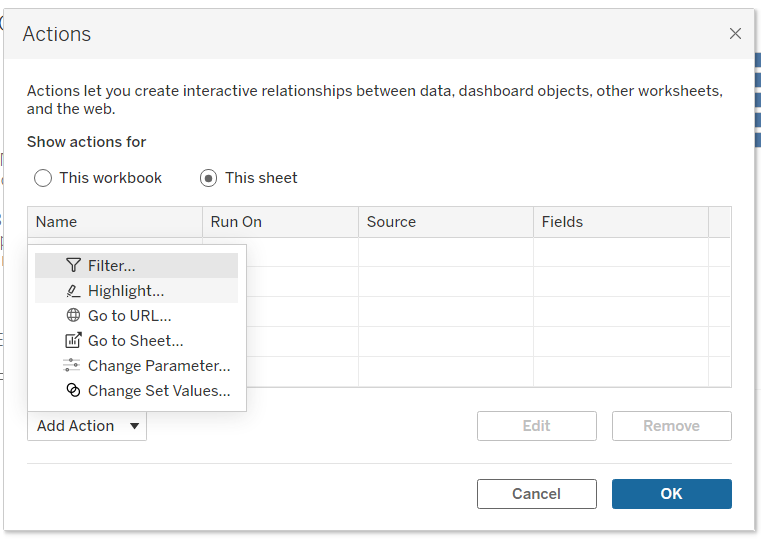
- Pick your run action
- Target highlighting -> Selected Field -> Our highlight field we created

Now it should work
Method 2:
- Click on the highlight button and select the "highlight field" we created.
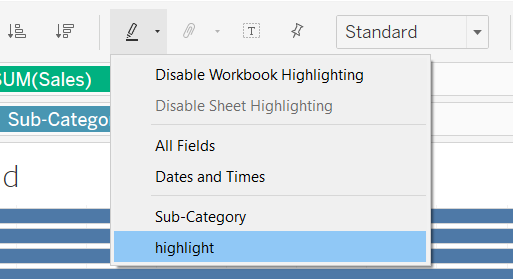
- Now it should work

Note: I now realise I should have remained my new field something other than "highlight" as it can get confusing. "Dummy" would have been better to show.