


Todays dashboard week challenge was a short one for me as I was mainly doing handover at my new placement that I'll be starting next week.
So be prepared for a very short and sweet blog and also no dashboard.
I only had less than 1.5hrs dedicated to my dashboard challenge today which was a bit sad because when I saw the challenge today I was so excited!
The Challenge:
Using the Api from breaking bad found here, we had to create a dashboard.
My original idea was to create a fan page/wiki page style dashboard.
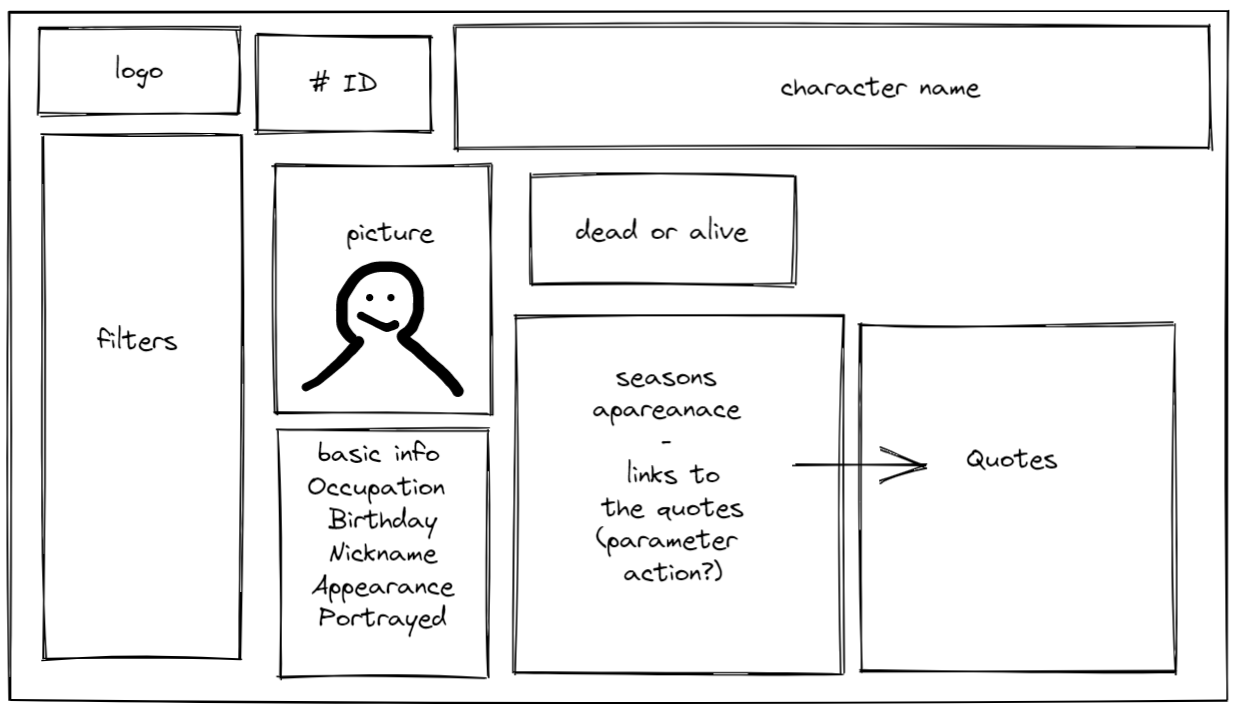
Because of my issues With the quotes, I decided to do another dashboard take - being only focusing on the the dead characters.
Onto Alteryx:
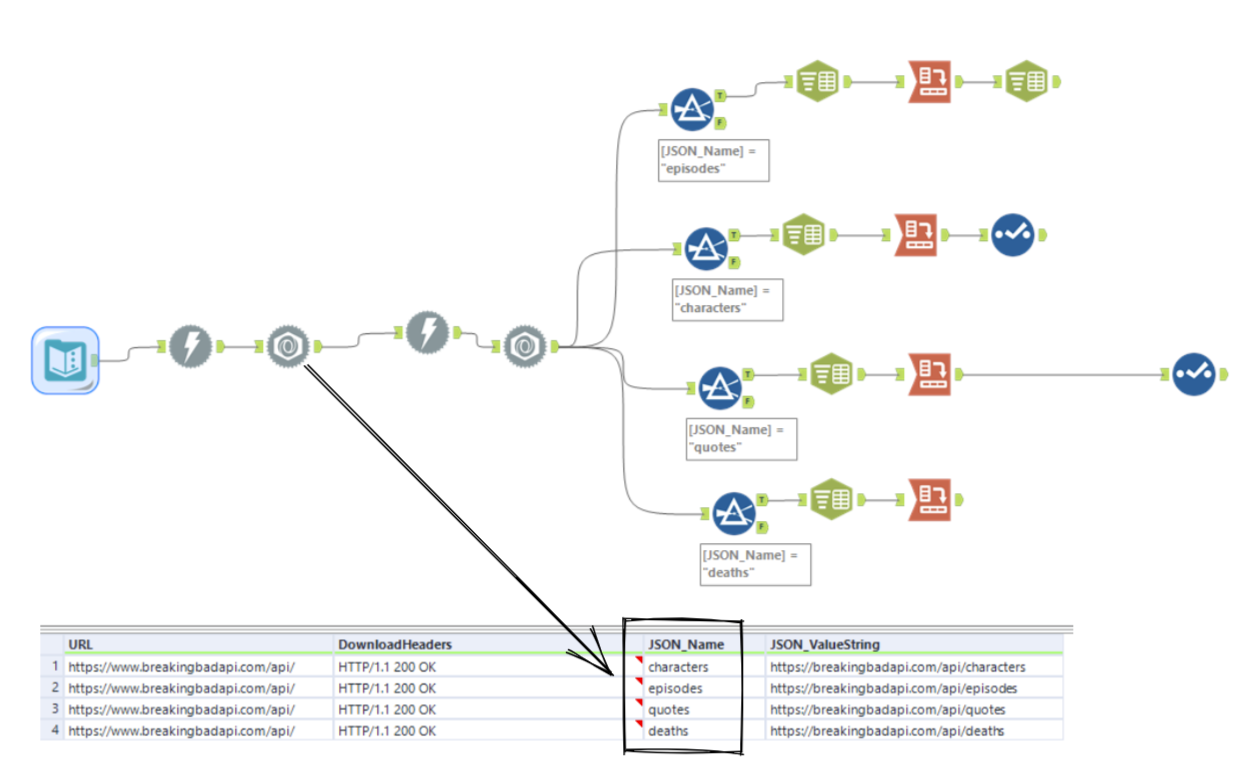
Bringing the API onto Alteryx today was very easy because of the Monday API challenge so I do feel myself improving.
Although my workflow is still a work in progress.
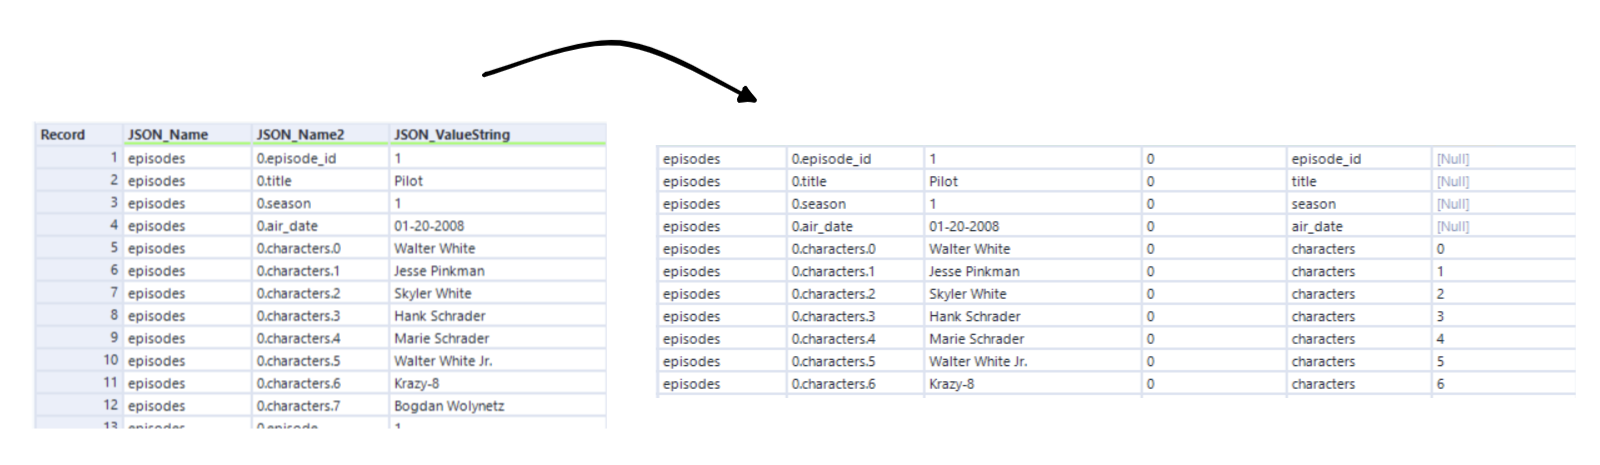
Initially I wanted to join all the data in the end to create 1 big dataset but after hearing the other cohort members saying that there is no relating fields to all of the information - I then realized it wouldn't be feasible to join it all.
Instead it would be better to have 4 tableau hyper extracts and then form relationships in tableau.
I also learnt how to bring an image in from a URL in tableau.
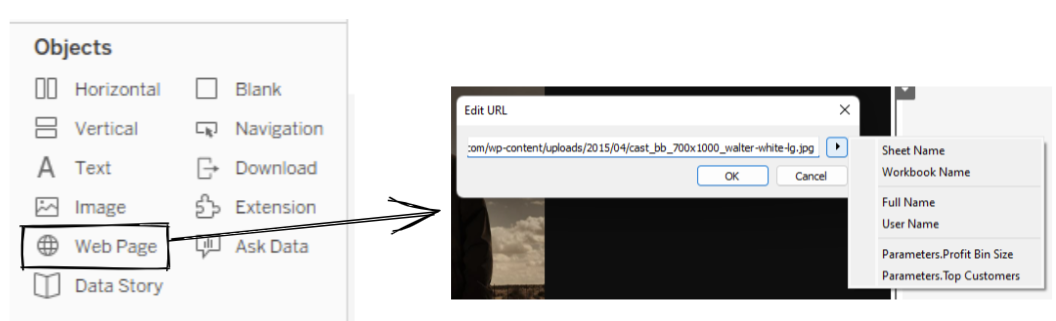
I could either enter the URL directly into the pop up or create a parameter to change the image using the drop down arrow.
I also learnt a new way where you would write 'test' in the edit URL and then put the URL on detail for another bar chart. Then create a URL action on that bar chart referencing the 'test'. - I will try it when I create my dashboard and edit this blog on how to do the profile pictures of each characters and hopefully they will update when you select a specific character.