


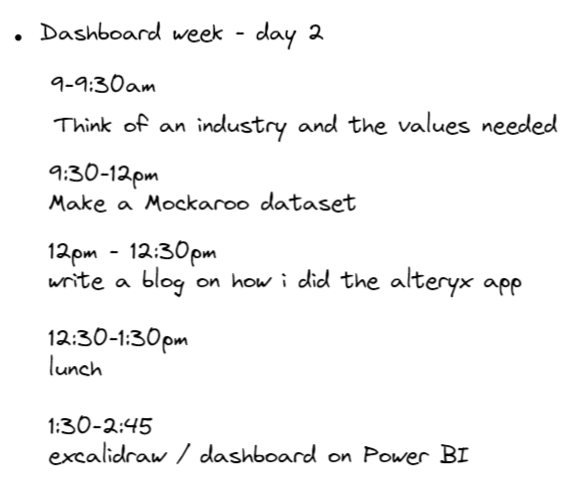
After the first horrific day of dashboard week - I was mentally preparing for today.
The TASK:
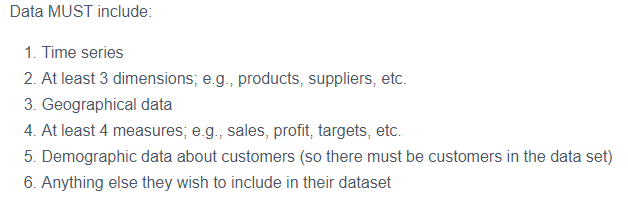
We need to pick an industry - any industry we liked. Then build your own data set using Mockaroo and finally create a KPI dashboard using Power BI.
So first I decided to make an industry and my quick dataset idea:
My Plan:
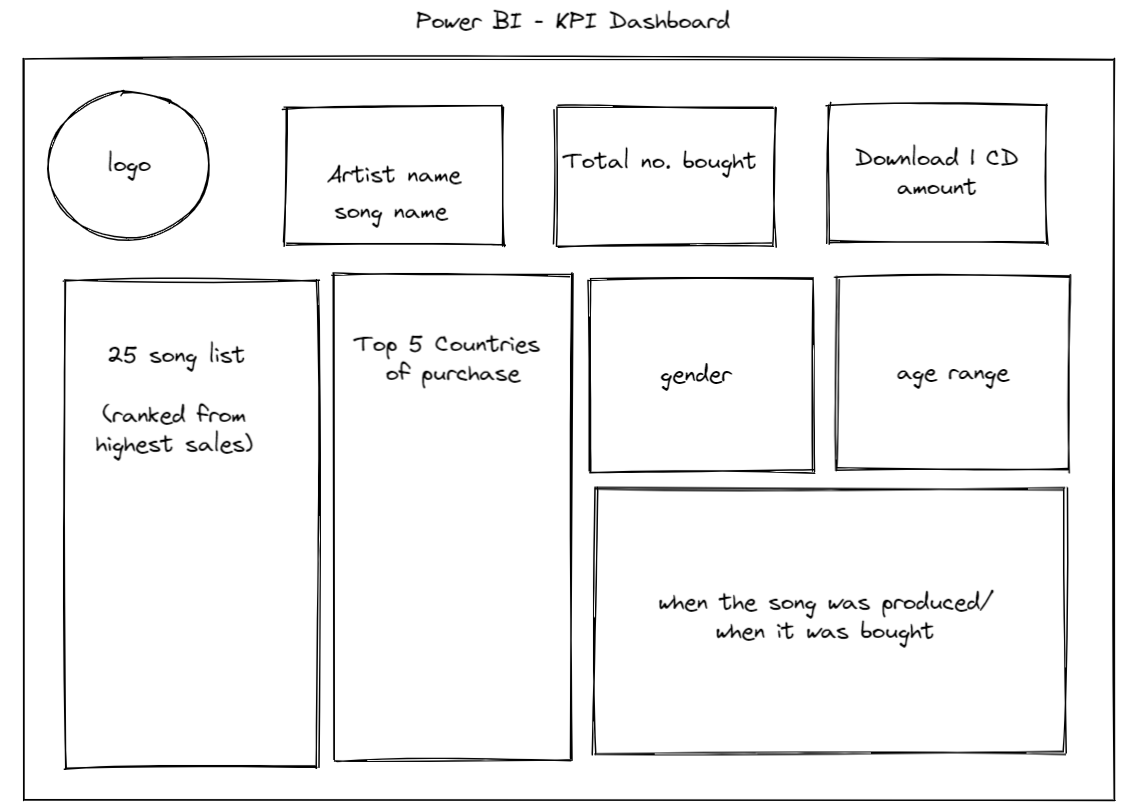
I knew I wanted 5 artists that each produced 5 songs - 25 in total
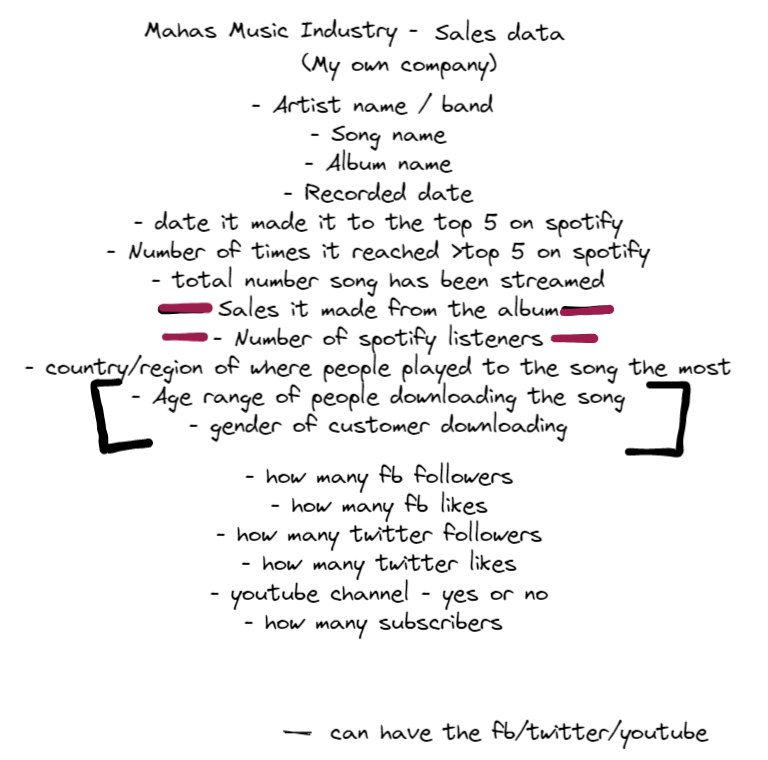
The issue I was having was what would my 1 row of data represents?
- 1 row of data can be 1 sale - this can include the gender and age of person who downloads
- 1 row of data will be 1 song and its info
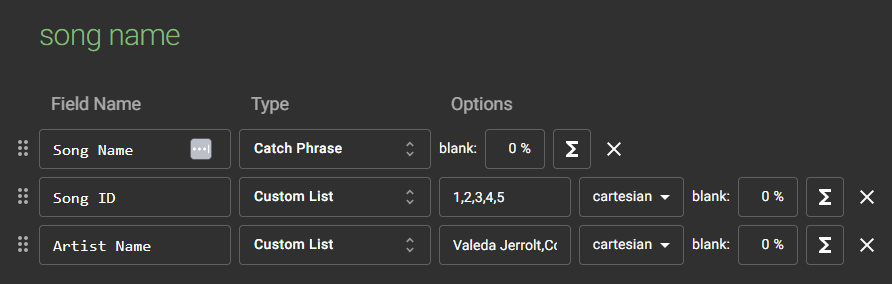
Creating the dataset - Mockaroo
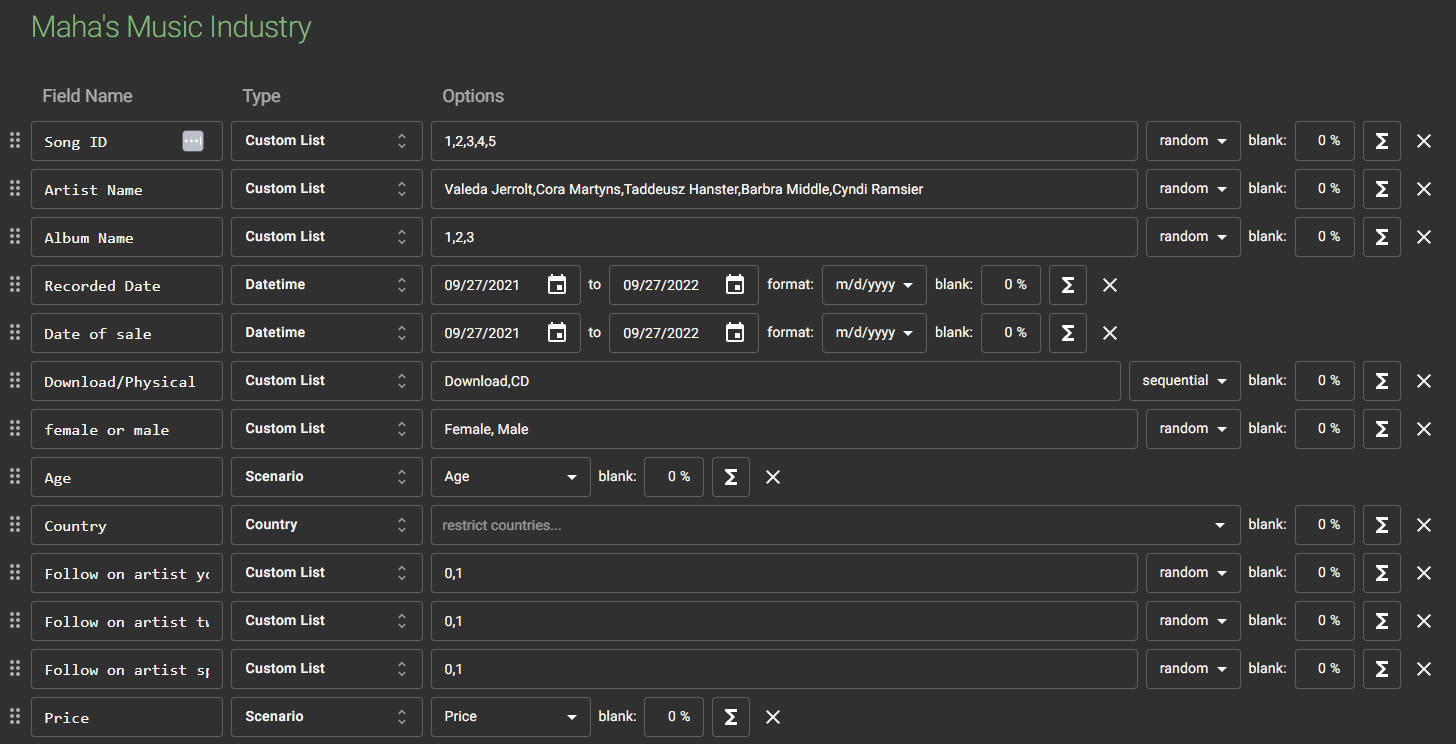
To combat this issue - I created another dataset in mockaroo that only has the 25 songs linked to the artists and I created a song ID which I should be able to join once in PowerBi
Brainstorm:
Power of PowerBi:
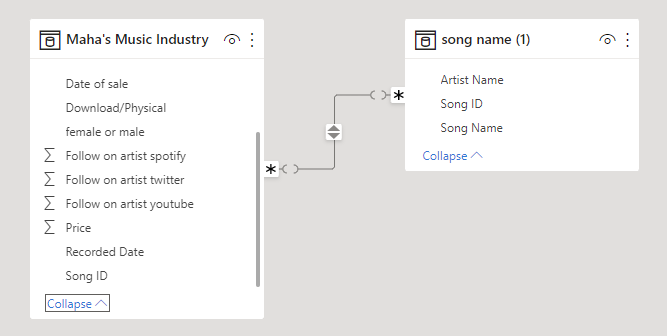
PowerBi only accept excel worksheets, so once I downloaded them from Mockaroo as a csv, I saved as an excel workbook.
I then had to do a relationship/join between my 2 tables in power Bi - this was actually very simple.
In the time I was given, this was the KPI dashboard I was able to create.
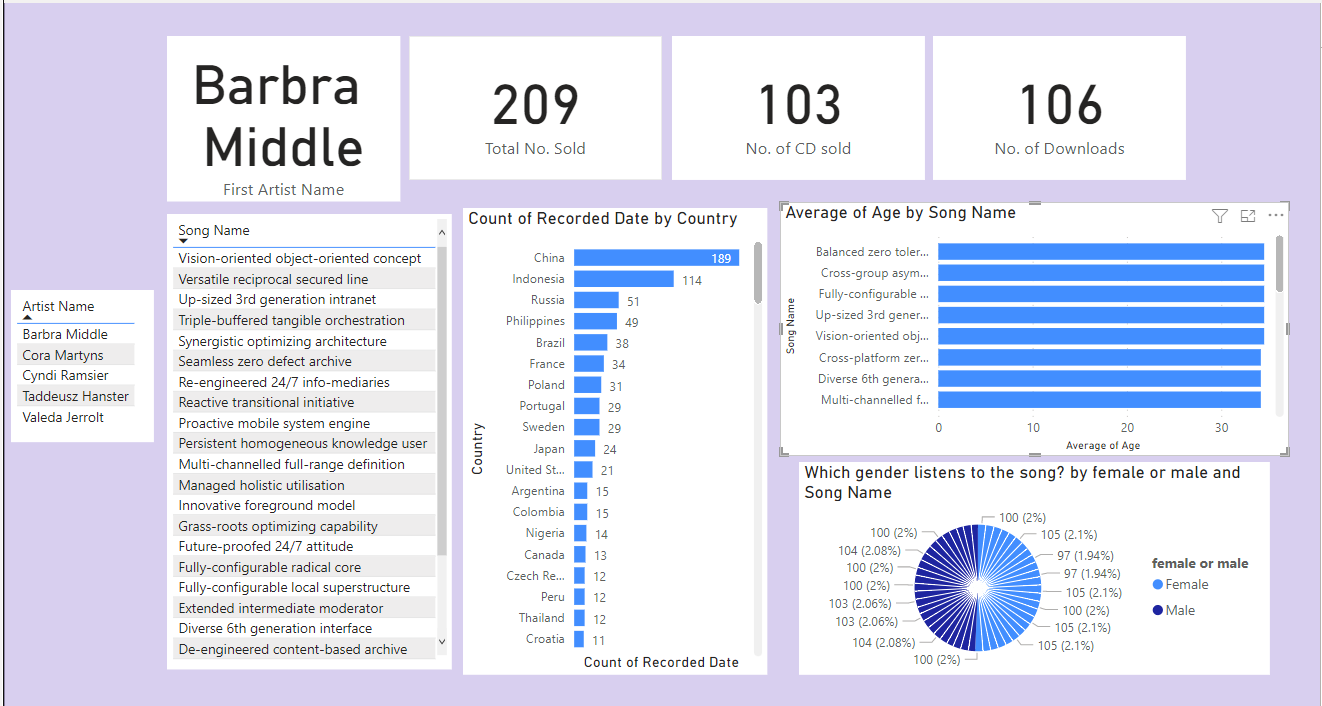
Not my best work I must admit. But I did find the actions in PowerBi to be much easier as they are automatic compared to tableau.
I will be remaking this dashboard in tableau when I have time.