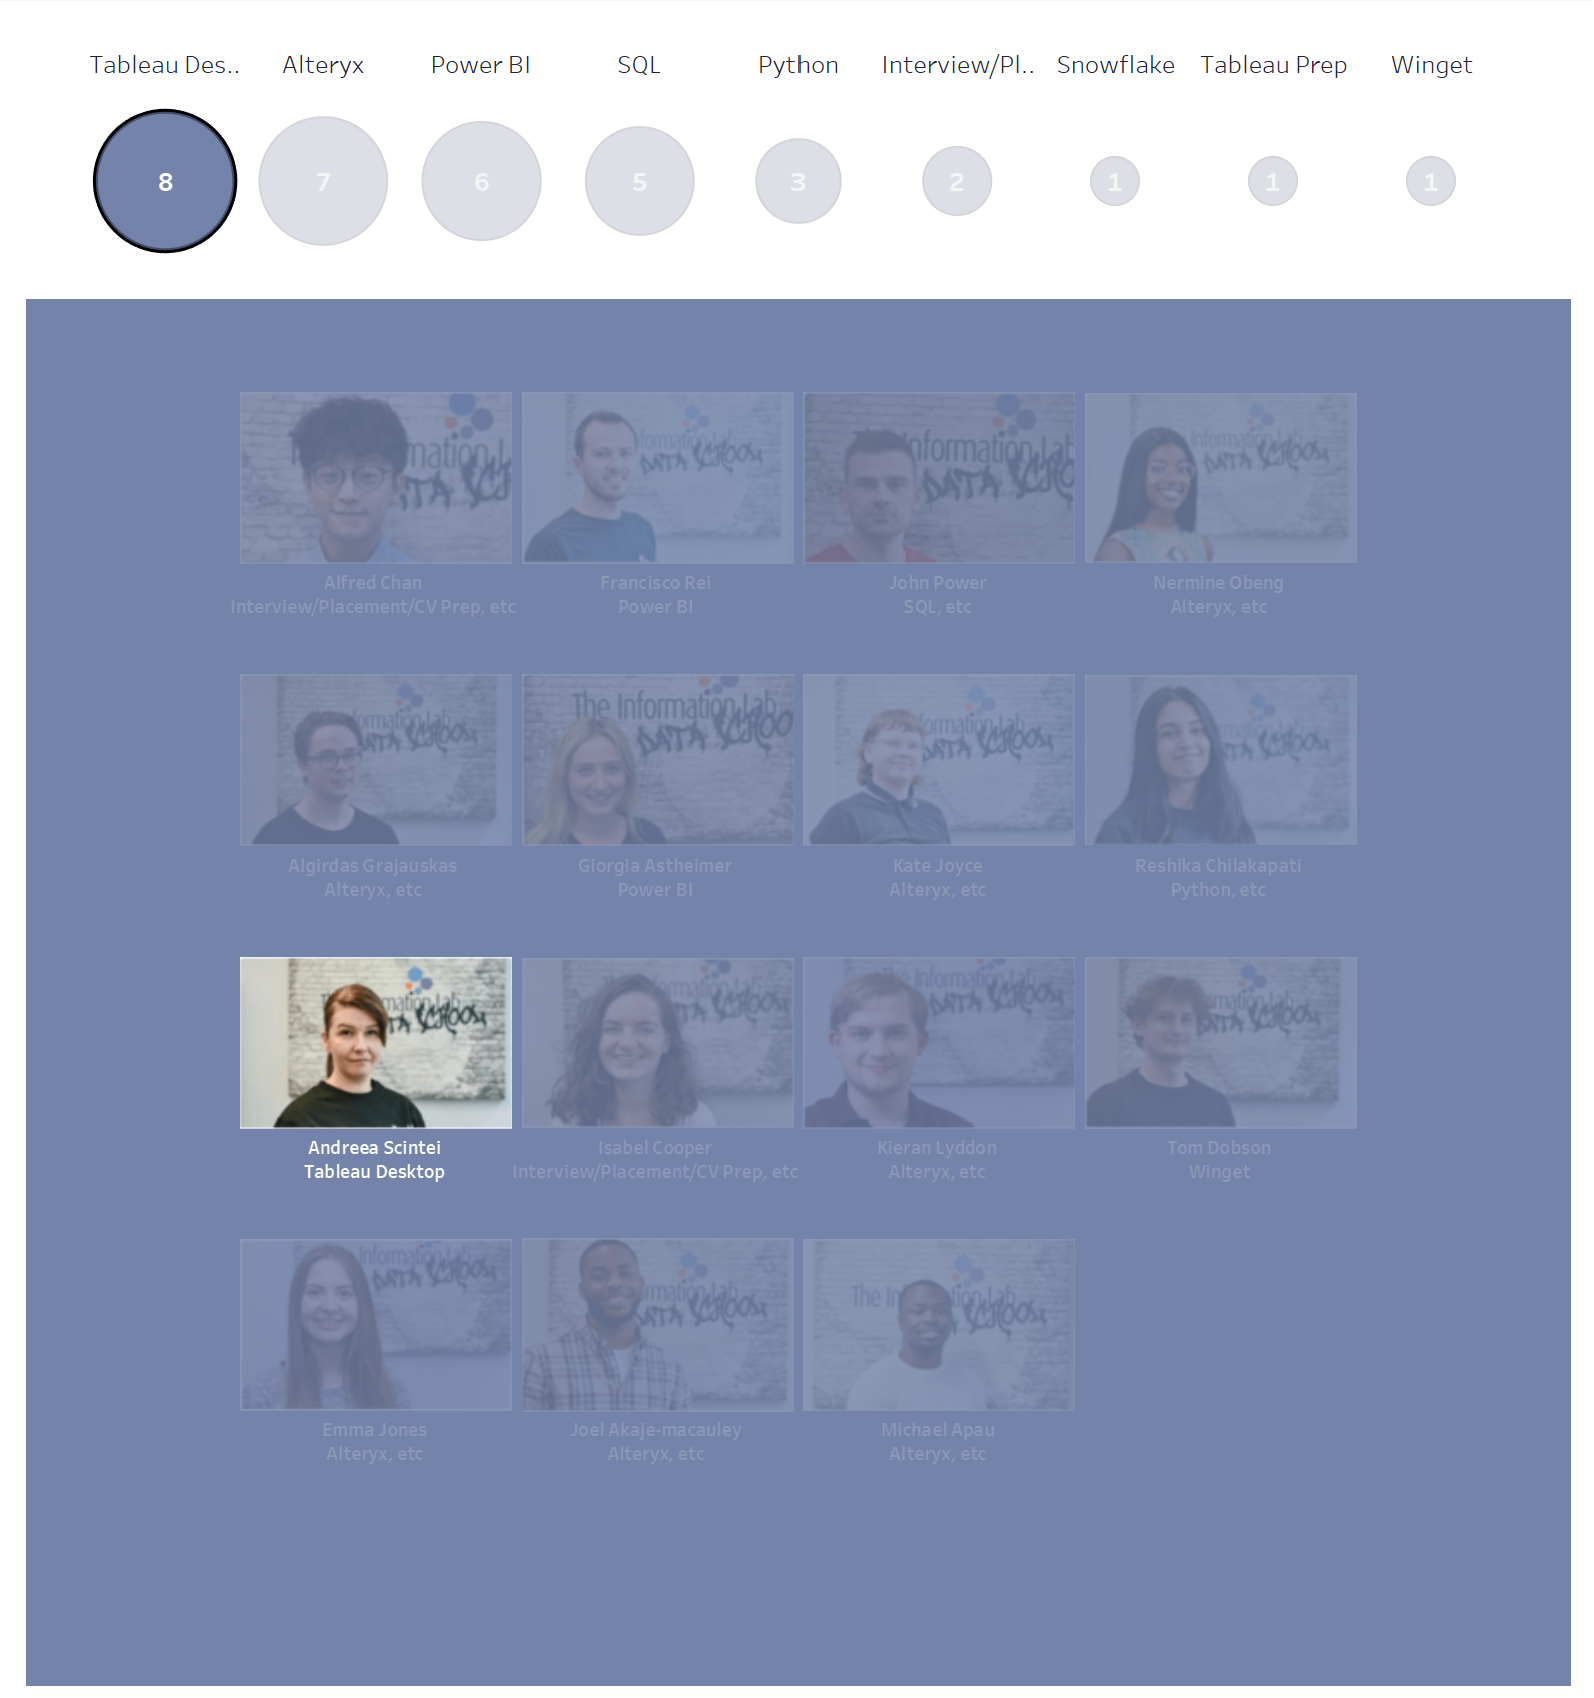
This week I have been working on a dashboard for the Data School.
The project included a really interesting application of highlight actions, which
We have data in this form, where each person used one or more skills in a project:
| Person | Project Type |
|---|---|
| Alfred | Tableau Desktop |
| Alfred | Python |
| Alfred | Interview Prep |
| Francisco | PowerBI |
| Algirdas | SQL |
| Algirdas | Tableau Desktop |
| Algirdas | Alteryx |

Here, when selecting Tableau Desktop, only one person is highlighted even though 8 people used Tableau Desktop in their projects.
Data Prep
The first step is to get the data in the right shape. Because the attribute function in tableau returns "*" when
| Person | Project Type |
|---|---|
| Alfred | Tableau Desktop, Python, Interview Prep |
| Francisco | PowerBI |
| Algirdas | SQL, Tableau Desktop, Alteryx |
The final format for the data was
Calculations
A way to get around the need for the attribute function is to use a parameter. I used the Project type field values in a string parameter and created a calculated field that checks if the Keywords field contains the word in the parameter.
That is a Bool value, which will be the same for every row associated with one person, so it can be put into Detail in the Marks card on both sheets. This will be the field that controls the highlighting, and the one present in both sheets.
But what happens now when I select Alteryx?

Some people will have worked with Alteryx and something else. For example, here 4 people worked with Tableau and Alteryx, so the Keyword string looks like "Tableau Desktop, Alteryx, etc." Because that string contains both, the parameter action will split the circles as above.
Because of this, we need an LOD calculation to get back the total numbers.
We use the "exclude" function, as
{EXCLUDE [Contains Circle Keyword]: COUNTD([ID])}
and drag it onto Size and label.
Now when the circles split they are the same size:

To solve this we add, to the circle sheet, a filter to remove one of the two circles where the mark splits into two.
We use the table calculation FIRST()=0 computed using only the [Contains Circle Keyword].
Final Result
The last step is to set up the dashboard action, which is a highlight action set to act on the Circle keyword field.
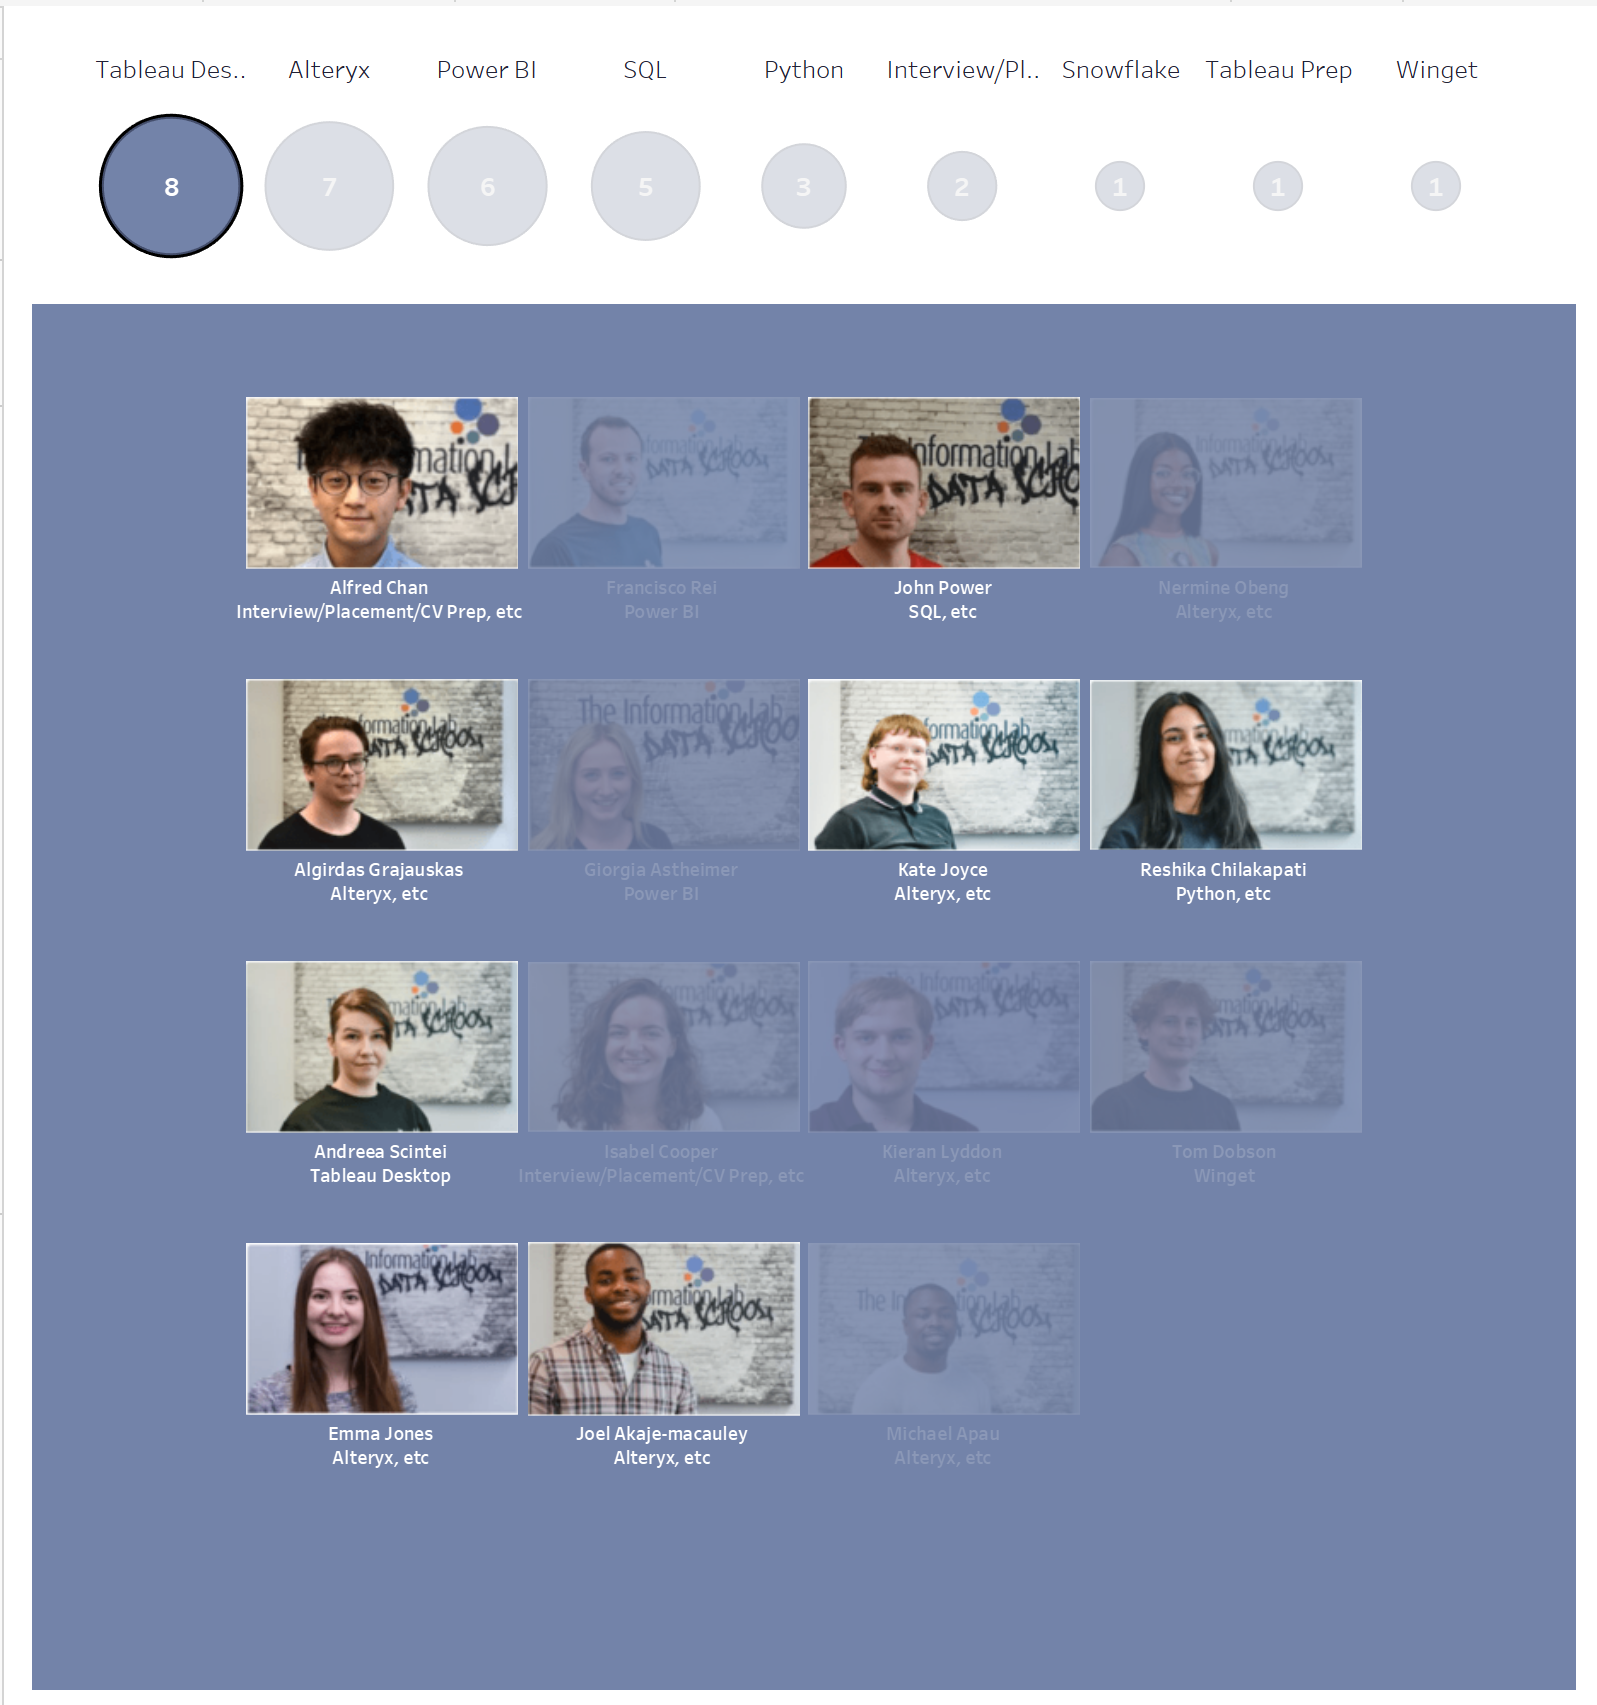
Now the dashboard highlights the correct number of people:

