


Data tables come in many different shapes and sizes, and sometimes it’s unclear which format is best for the analysis you want to do. In this post, I will explain the differences between wide and long format data tables and help you understand the pros and cons of each.
Data tables are often referred to as “wide” if they have many columns and fewer rows and “long” if they have many rows but fewer columns. Tables can be reformatted by pivoting the columns to rows (making the table longer) or rows to columns (making the table wider). Tables are generally in a wide or long format, but they can also be somewhere between the two if only part of the data is pivoted.
In a wide format table, every variable gets its own column, whereas in a long table there is generally one column with the name of the variable and another column with the corresponding values. Here is an example of the same data in a wide vs long format:
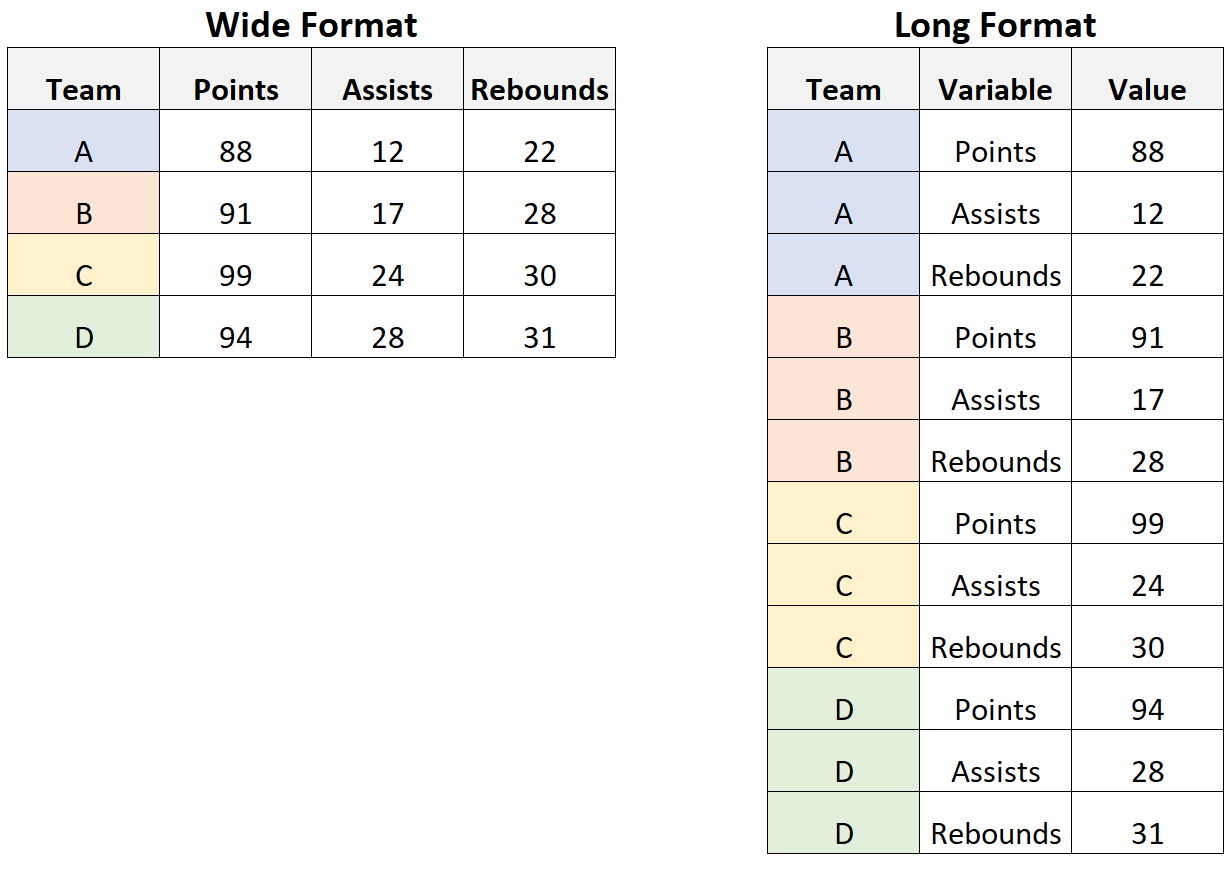
In the wide table, points, assists, and rebounds all get their own column, and each team gets precisely one row. In the long format, there is a row per team and variable name (points, rebounds, assists), meaning that each team has 3 rows rather than 1.
So, why would you prefer one format over the other? You might have noticed that Excel tables are almost always in a wide format, with each variable getting its own column. Wide formats make it far easier to understand the data at a glance, as long formats can be less intuitive to read. Wide formats also allow for row-level calculations because the metrics for one group or ID (team in the example above) are all in different columns along the same row that can be referenced in a calculation. For example, if I wanted to know the sum of assists and rebounds for each team, I could just sum the assists and rebounds fields, whereas with the long table I’d have to perform a more complicated calculation (for example using IF statements or Level of Detail calculations). In other words, wide format tables allow you to compare and calculate between two different variables much more easily. Another example where you would want to have metrics in their own columns is using RegEx (the tool in Alteryx as well as the functions in Alteryx and Tableau), which allows you to parse out or replace parts of a string by identifying patterns. If two metrics have different patterns or data cleaning errors that you want to parse out, you would want them in different columns.
So why would you use a long table? The premier advantage of long format tables is performance; because columns contain metadata like the size and data type of the fields, columns require more processing power to load than rows. Therefore, reducing the number of columns generally increases querying / load times. This is partly why programs like Tableau “prefer” long format tables, as they are better optimized to read them.
Long format tables also tend to be more future proof as they don’t need to create new fields like a wide format would. If a new metric gets brought into the data, the wide data would need to gain a new column while the long data could add more rows. For instance, in the table below we have one column for the monthly sales of different stores. Though updating the data manually would be very easy in this format, as you just have to add a new column for December for example, this would create a new field in the dataset. If you have a calculation in Tableau meant to reference all of your columns, you would have to edit the calculation any time a new column is brought in. Similarly, adding new columns to your data when working with a wide format might cause issues with aggregations or other steps in an existing Alteryx or Tableau Prep workflow that don’t reference the new columns.
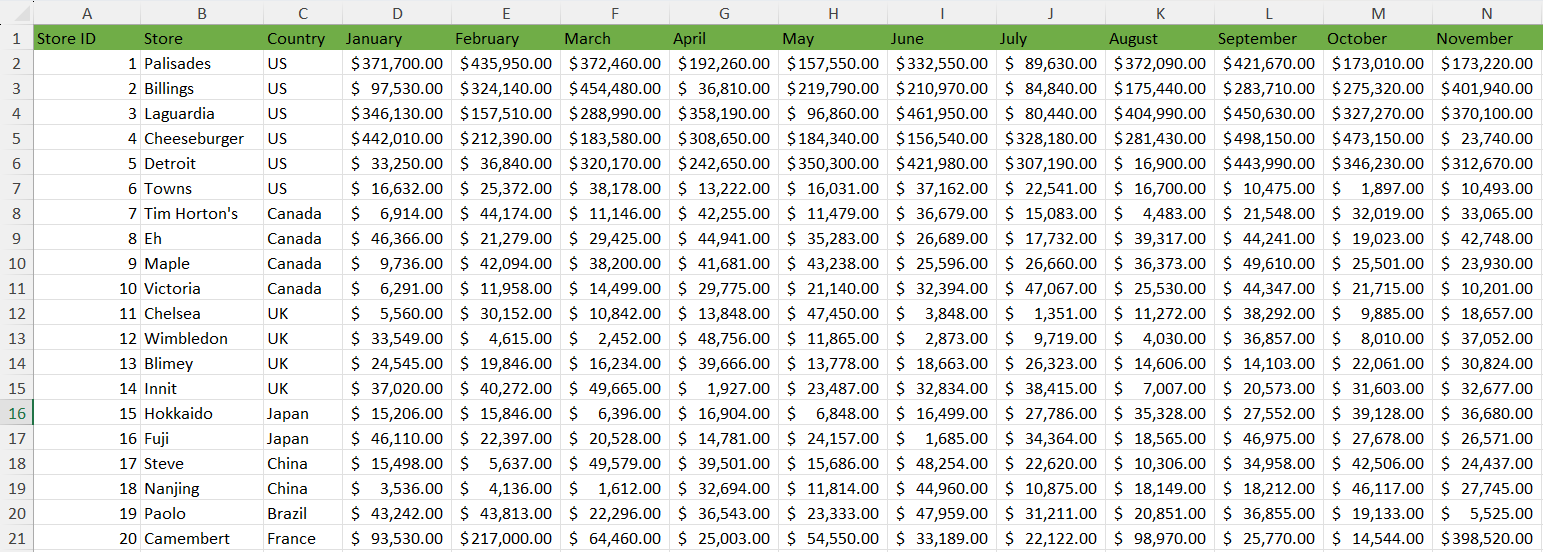
To conclude, what format of data you need depends on the type of data you have and what your priorities are. Wide format tables are easier to read and perform row-level calculations whereas long format tables are more performant and can make your calculated fields and aggregations more future proof. It’s also important to consider how different your metrics are: with the month columns in the table above, they would likely be better as a long format to have the month as a singular column and the sales as another column - this would allow you plot sales over time using the month field and perform aggregations on your sales. But if the metrics are completely different, like sales and units sold, you probably want them in their own columns to reference in calculations.