For this blog post, I will do a guided, step-by-step walk-through of a potential solution to Alteryx weekly challenge #219, with a specific focus on the ‘CROSS TAB’ tool.
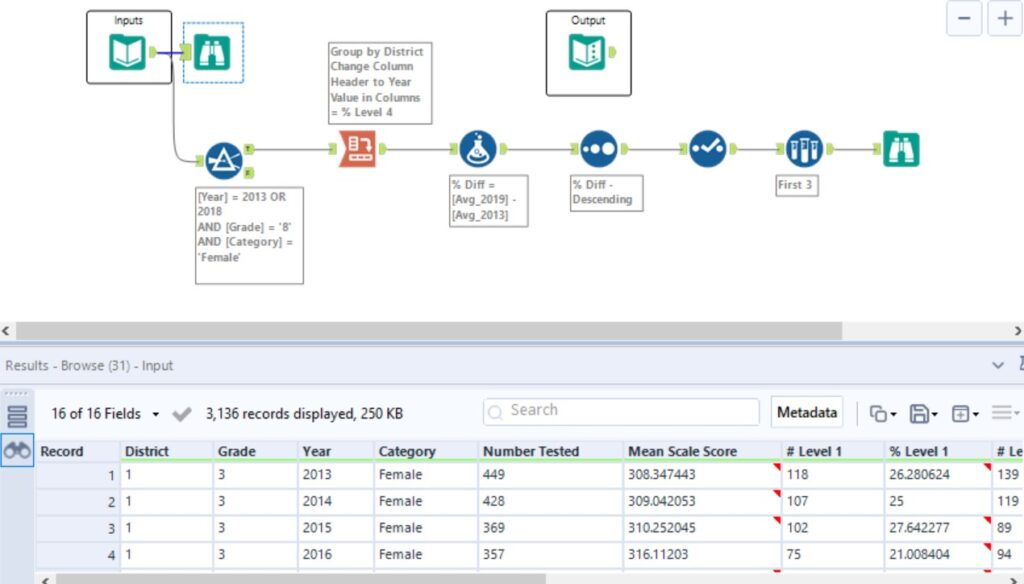
This data set looks at the results from a maths exam at a New York City Public School from between 2013 and 2019. For this challenge, we are only interested in the results from females in grade 8, focusing only on the years 2013 and 2019. We will therefore use the FILTER tool to only match these criteria.
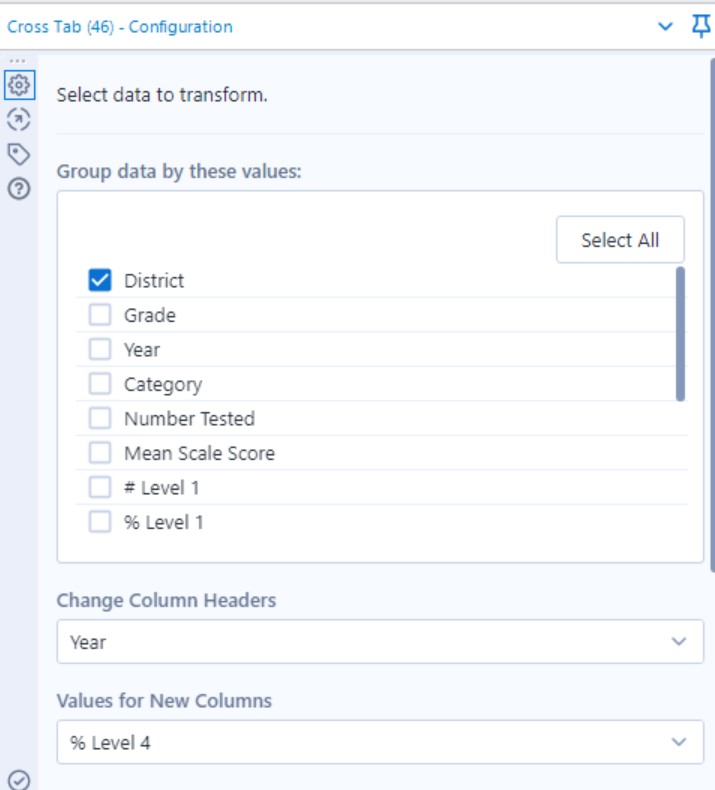
We also only want the data from girls who achieved level 4 on this particular exam, and which district these girls go to school, but the data here has far too many columns and metrics which should most definitely be headers. In this instance, the CROSS TAB tool will enable us to group the data by ‘district’, change a column header to ‘year’ and place the % of girls who achieved level 4 (‘% level 4’) as the new value within these columns. We now have just 3 columns stating the 1) district ; 2) % level 4 achieved in 2013 ; 3) % level 4 achieved in 2019.
Next, we will use a simple FORMULA tool to work out the difference in % between 2013 and 2019 using the formula (2019) – (2013). This will give us a new column with the % difference between the two years.
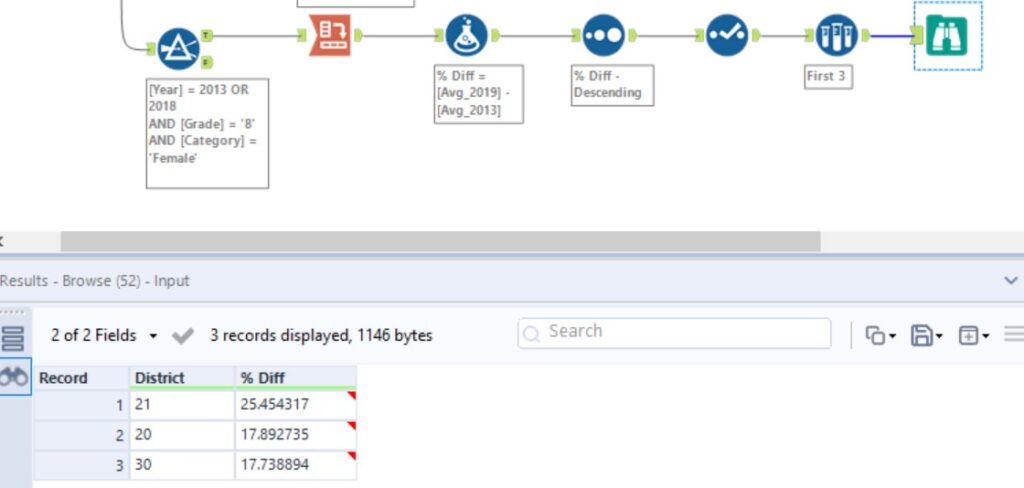
The next 3 steps are simple… We use a SORT tool to sort the % difference into descending order. We then use a SELECT tool to remove the 2019 and 2013 columns. Finally we can utilise the SAMPLE tool to only show the top 3 rows, thus giving us our desired output and completing this weekly challenge.