


For today's challenge DS48 and I were tasked with creating a PowerBI Report using mock company sales data. Essentially we had to answer a business question through a PowerBI Report. I ended up looking at Global Performance and Areas for Growth. Through this blog post, I'll take you through todays journey - my plan, sketches, ideas, and final product!
Plan
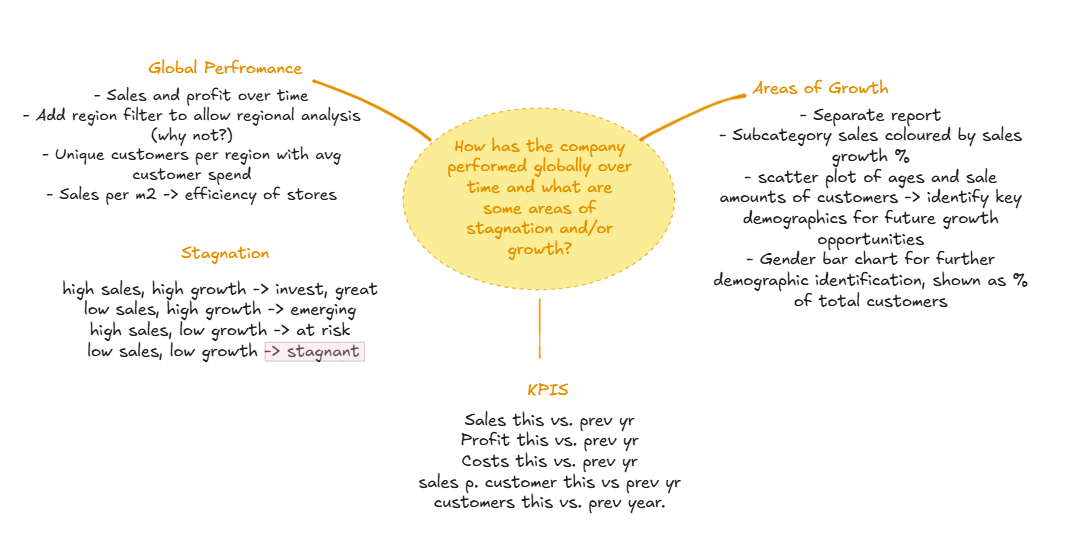
After reading the brief and selecting a business question to answer, I began by creating my to-do list, my mind map and my sketches. When planning, mind maps are my go to technique to use because that way I can pour out all of my ideas and make sense of them as I go along 😄.
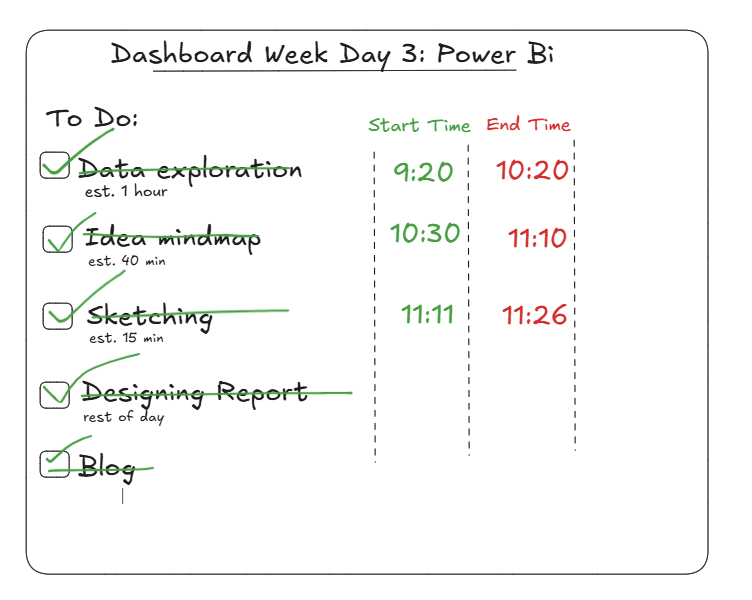
The rigid to-do list:
The idea mind map:
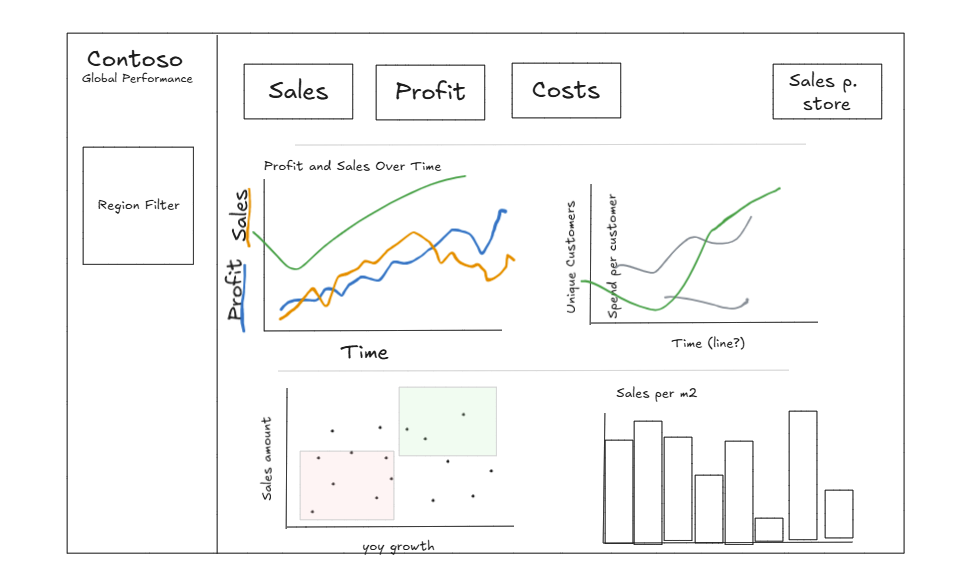
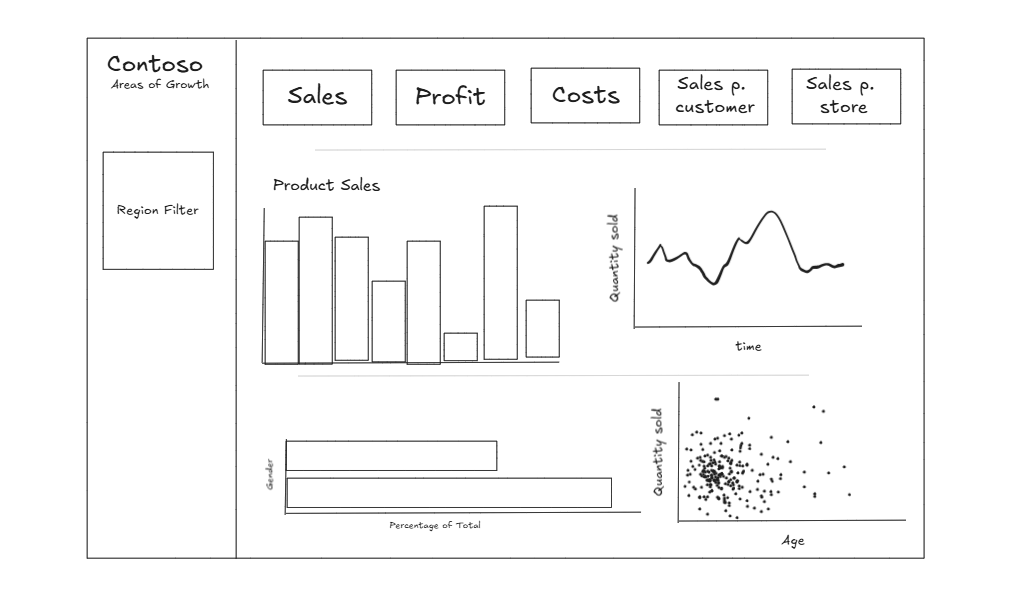
After my data exploration and ideas, I went ahead and started sketching my final product. This really helps when building as you constantly build with a goal in mind which helps you manage your time and organise yourself.
Process
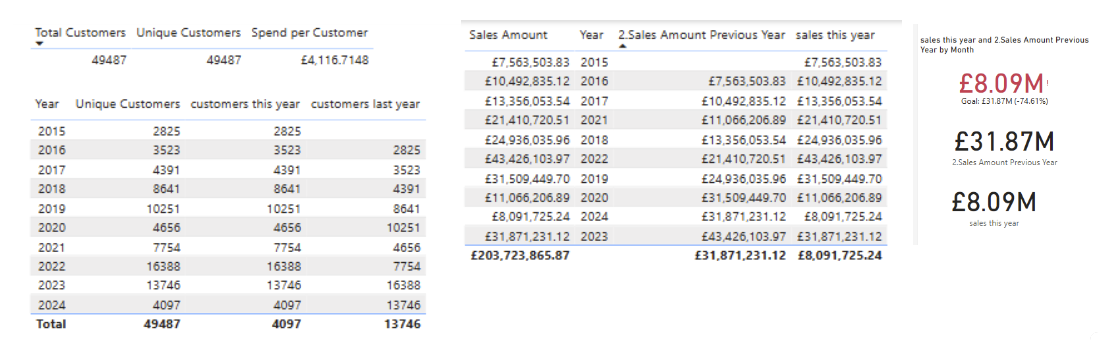
Throughout creating my report and KPIs, one thing I was constantly doing is validating my numbers. This is simple creating tables and dragging individual numbers into view to check they're right.
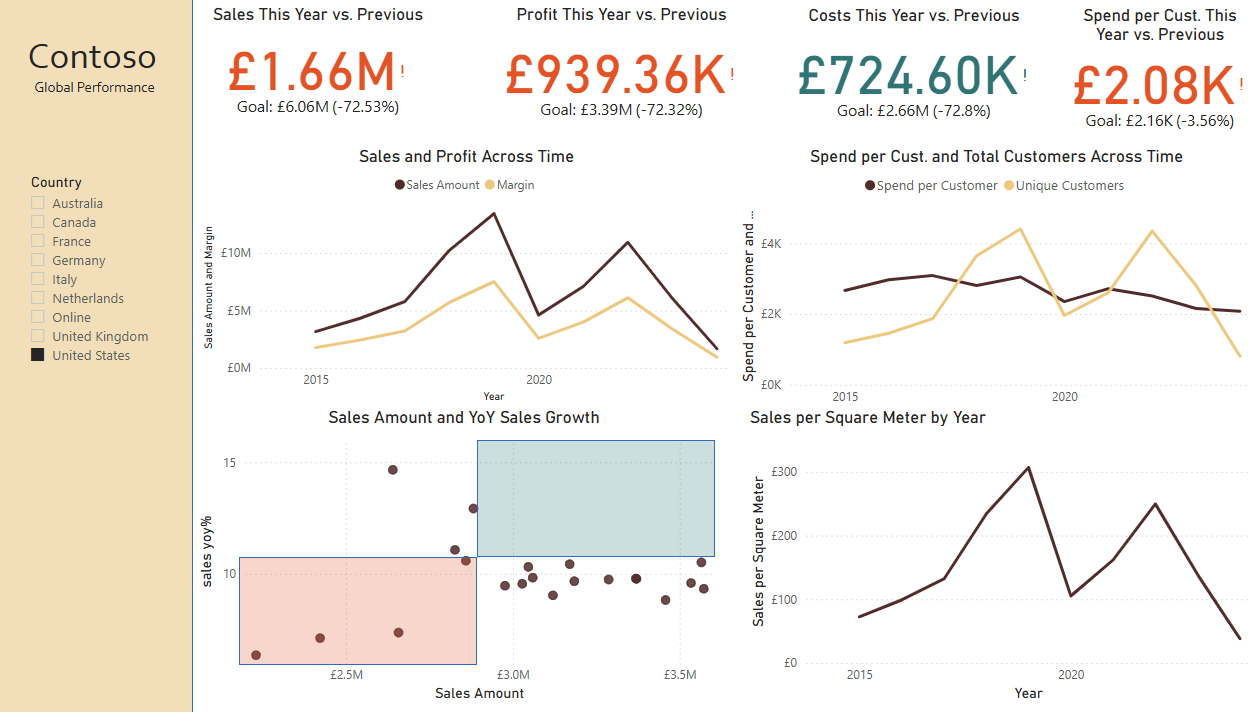
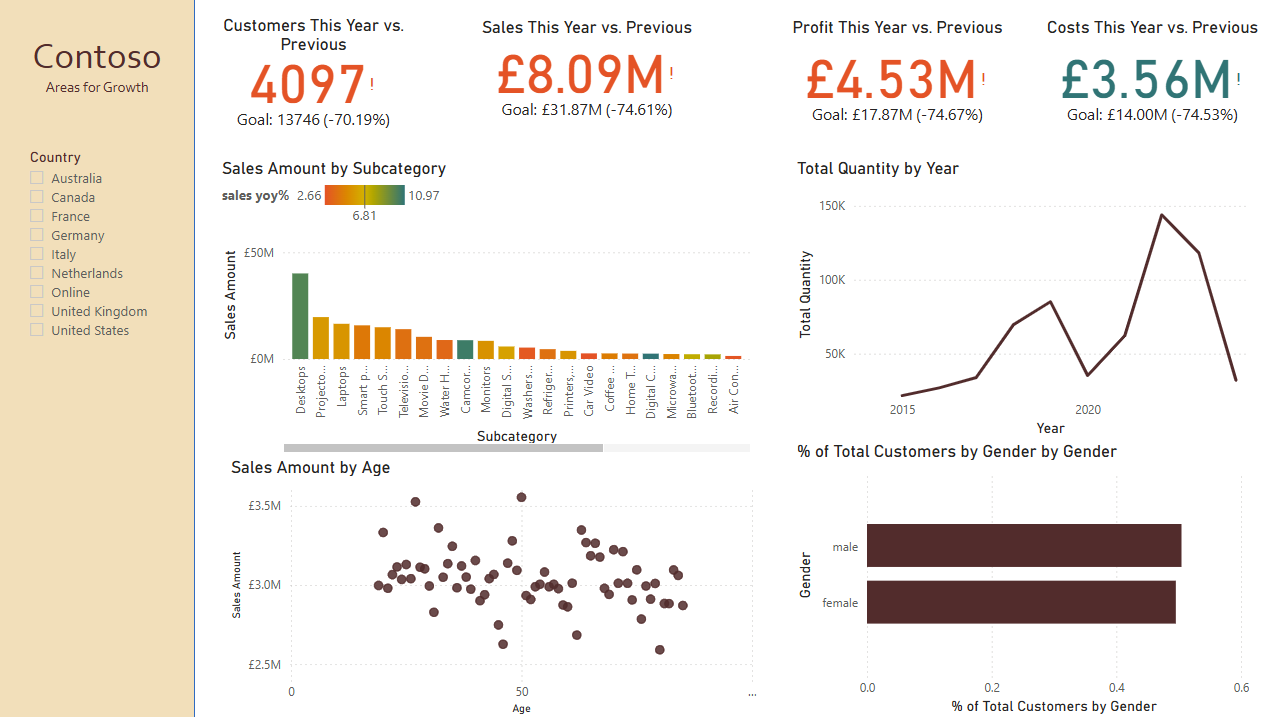
Final Product
And finally, the final product after rapid formatting and design choices:
Only 2 days left - excited for tomorrow's challenge!