


Cohort analysis is a powerful approach as it can give insight as to what proportion of sales different cohorts of customers are responsible for.
For example, we may want to see how many sales are new customers vs ones acquired a year ago for example.
To walk through how to do this in tableau, we are going to use our favourite dataset, superstore!
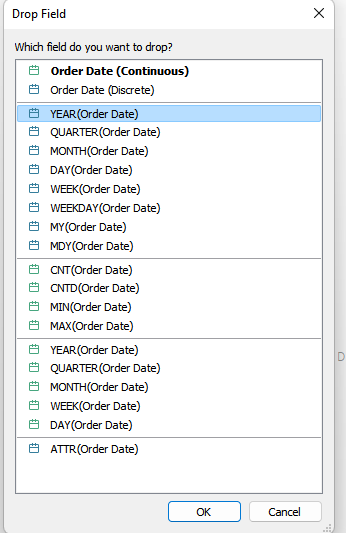
The first thing we want to do is right click drag order date to columns and select discrete year
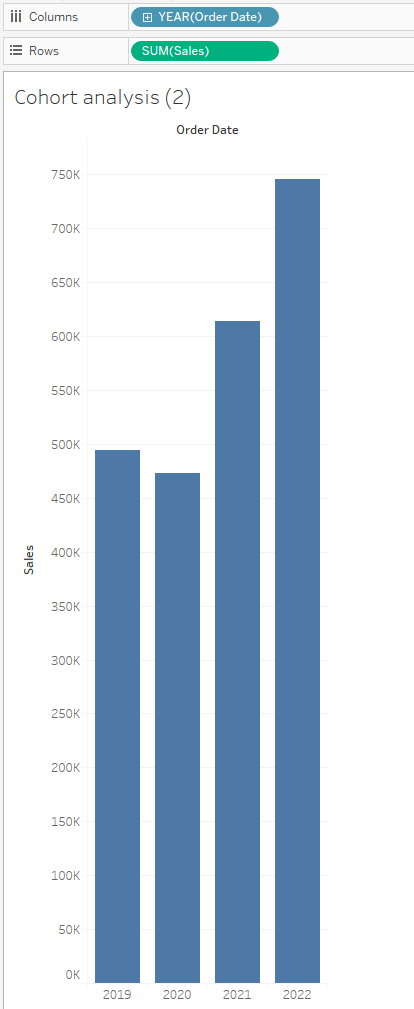
Then drag sales to rows and we should have the following view:
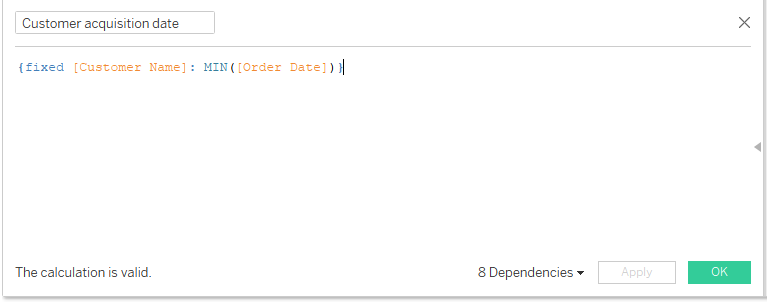
The next thing we need is the calculated field to determine the year in which the customer was acquired.
To do this, we need to fix the LOD calculation upon the customer name and then find the minimum order date which will be the first order that particular customer has made. Call this customer acquisition date
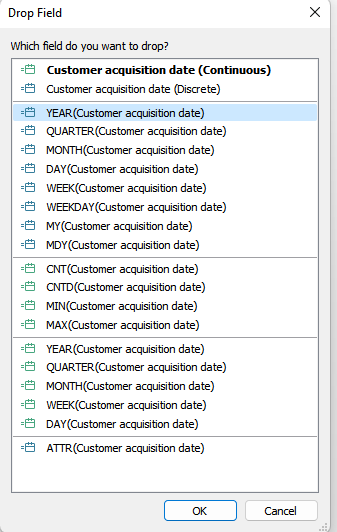
Then right click drag the calculated field onto the colour section on the marks card and select discrete year
And we should then have the following view, separated by customer cohort
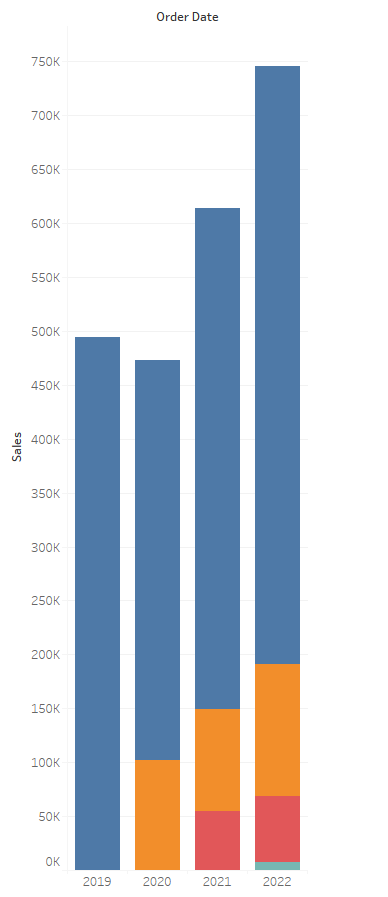
And voila, you’ve got sales divided by year, coloured by customer cohort !