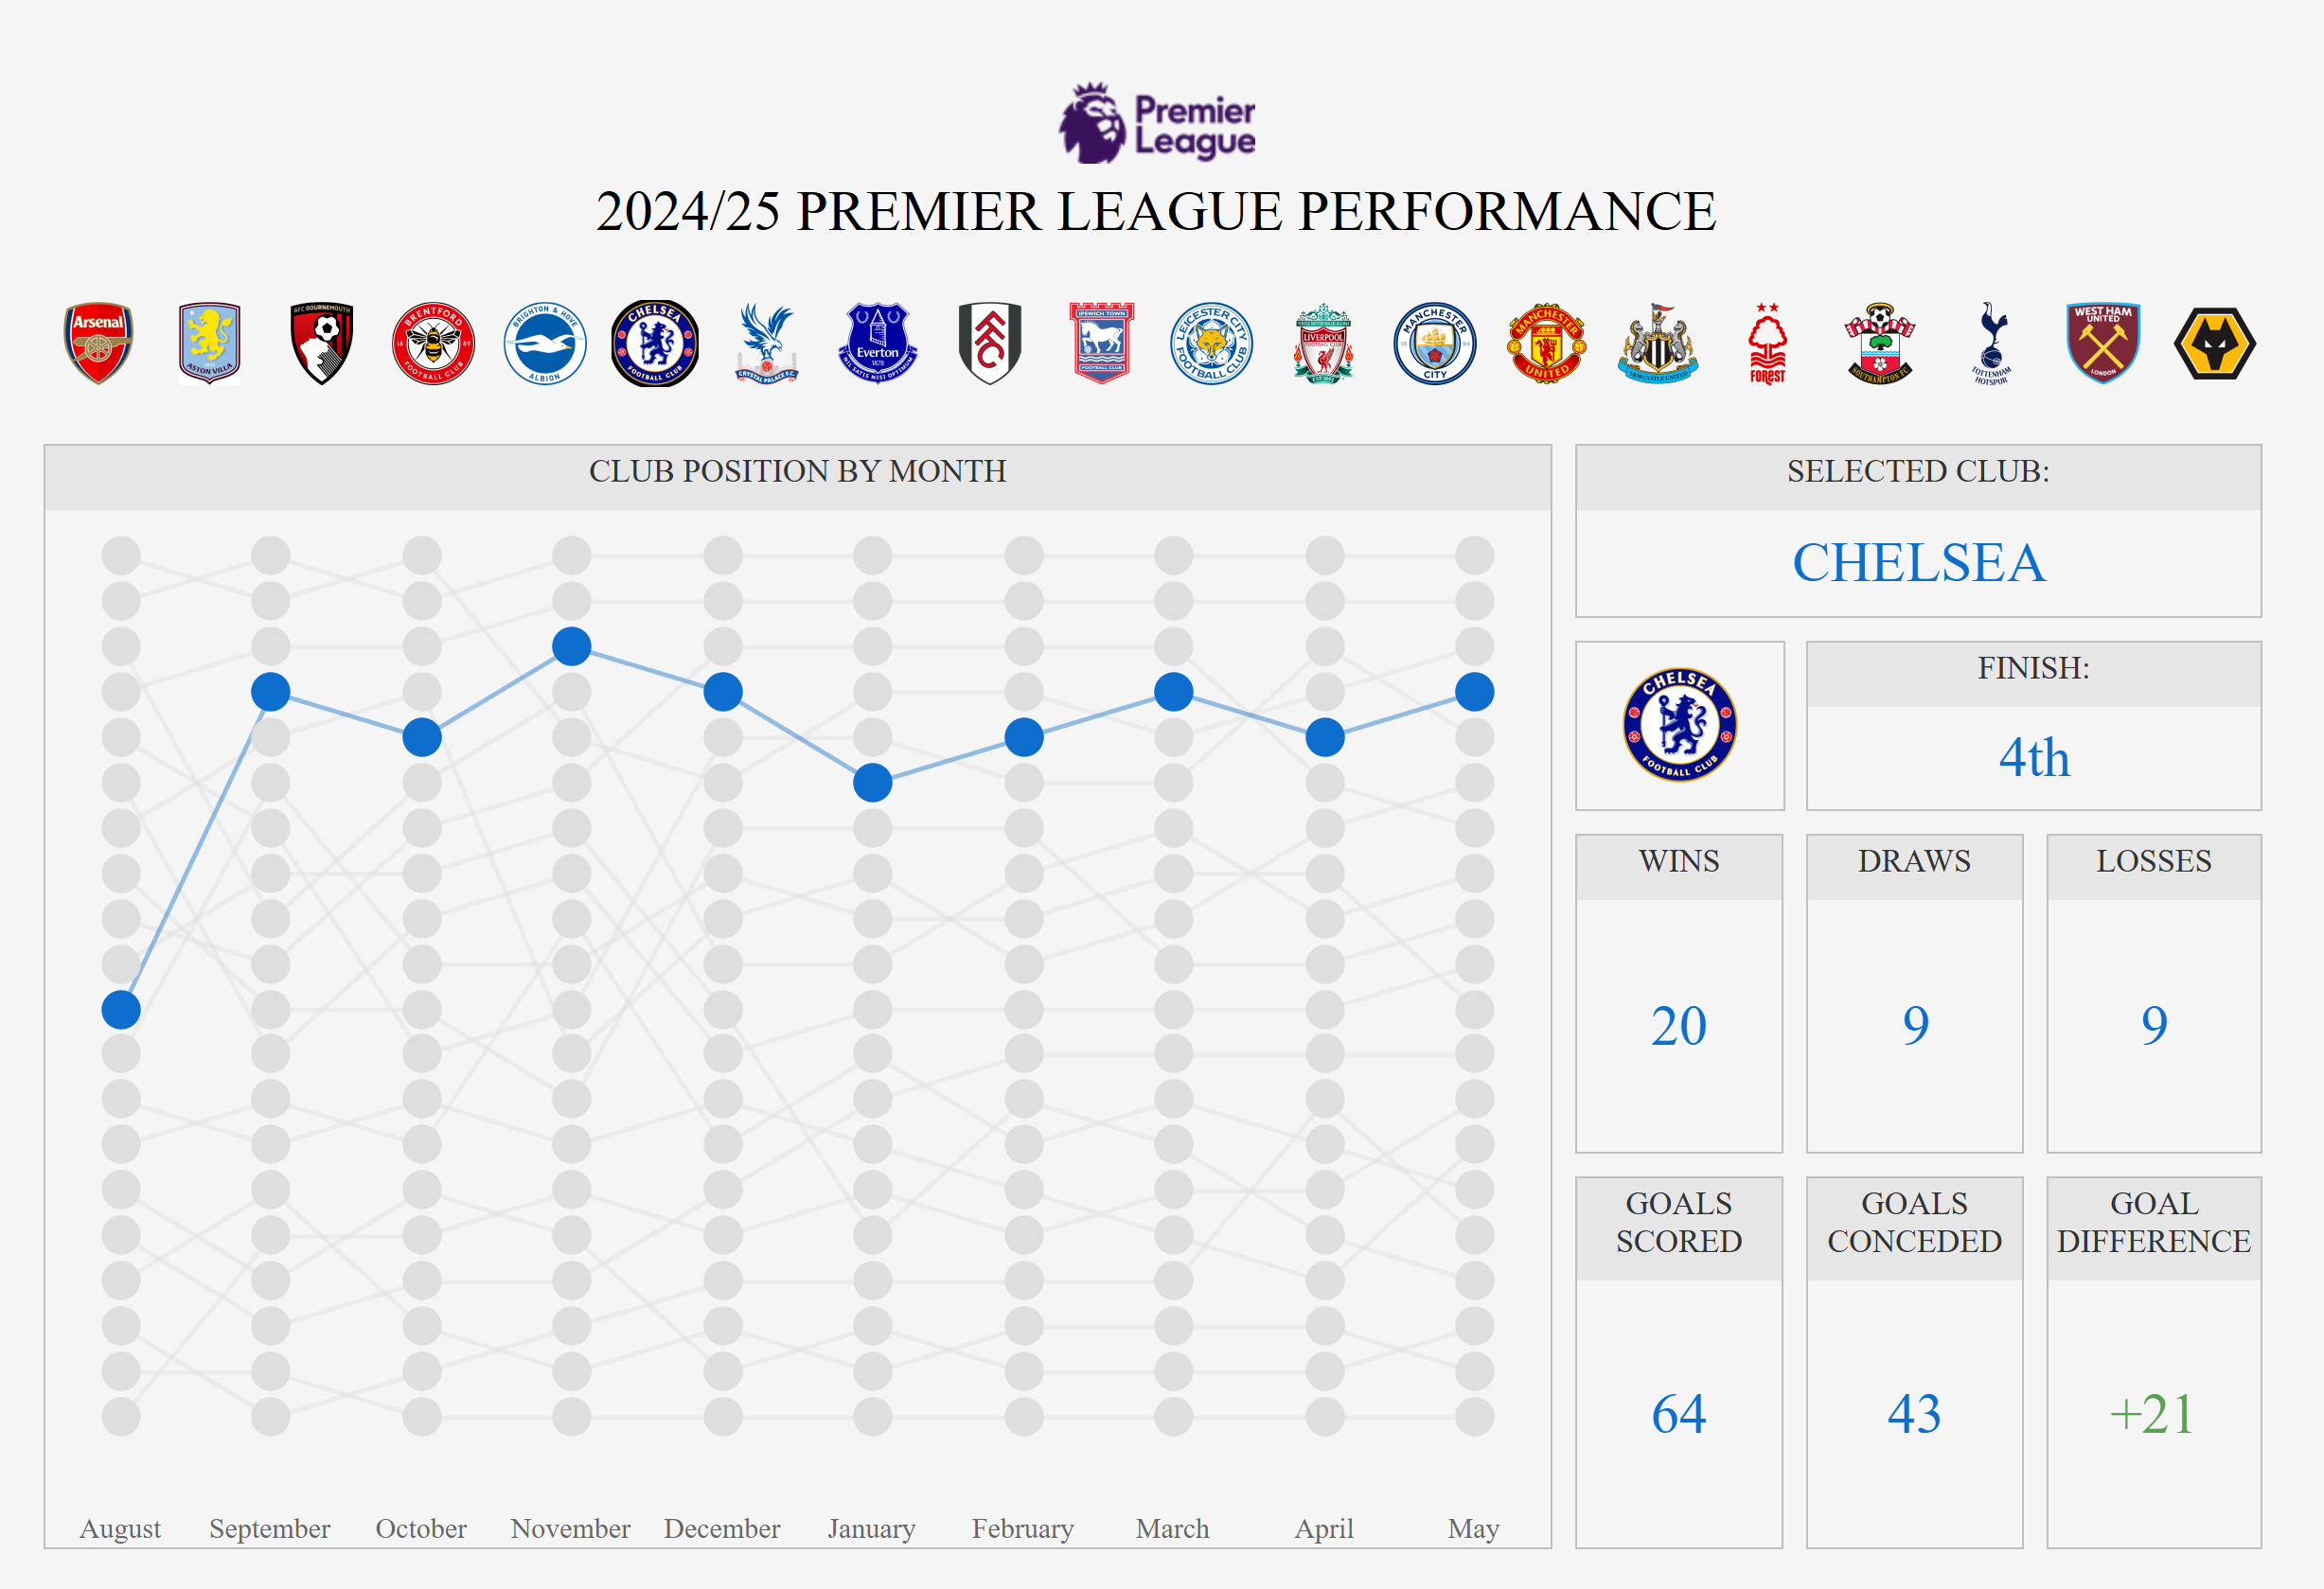
There are many use cases why you would want to use a change parameter action within a dashboard. In our particular case we want to be able to click on a premier league football club and see their corresponding statistics.
In the dashboard below we have 20 buttons along the top - one for each premier league football club. When we click on a club we want to see their specific club position by month on the left and all their season data on the right.
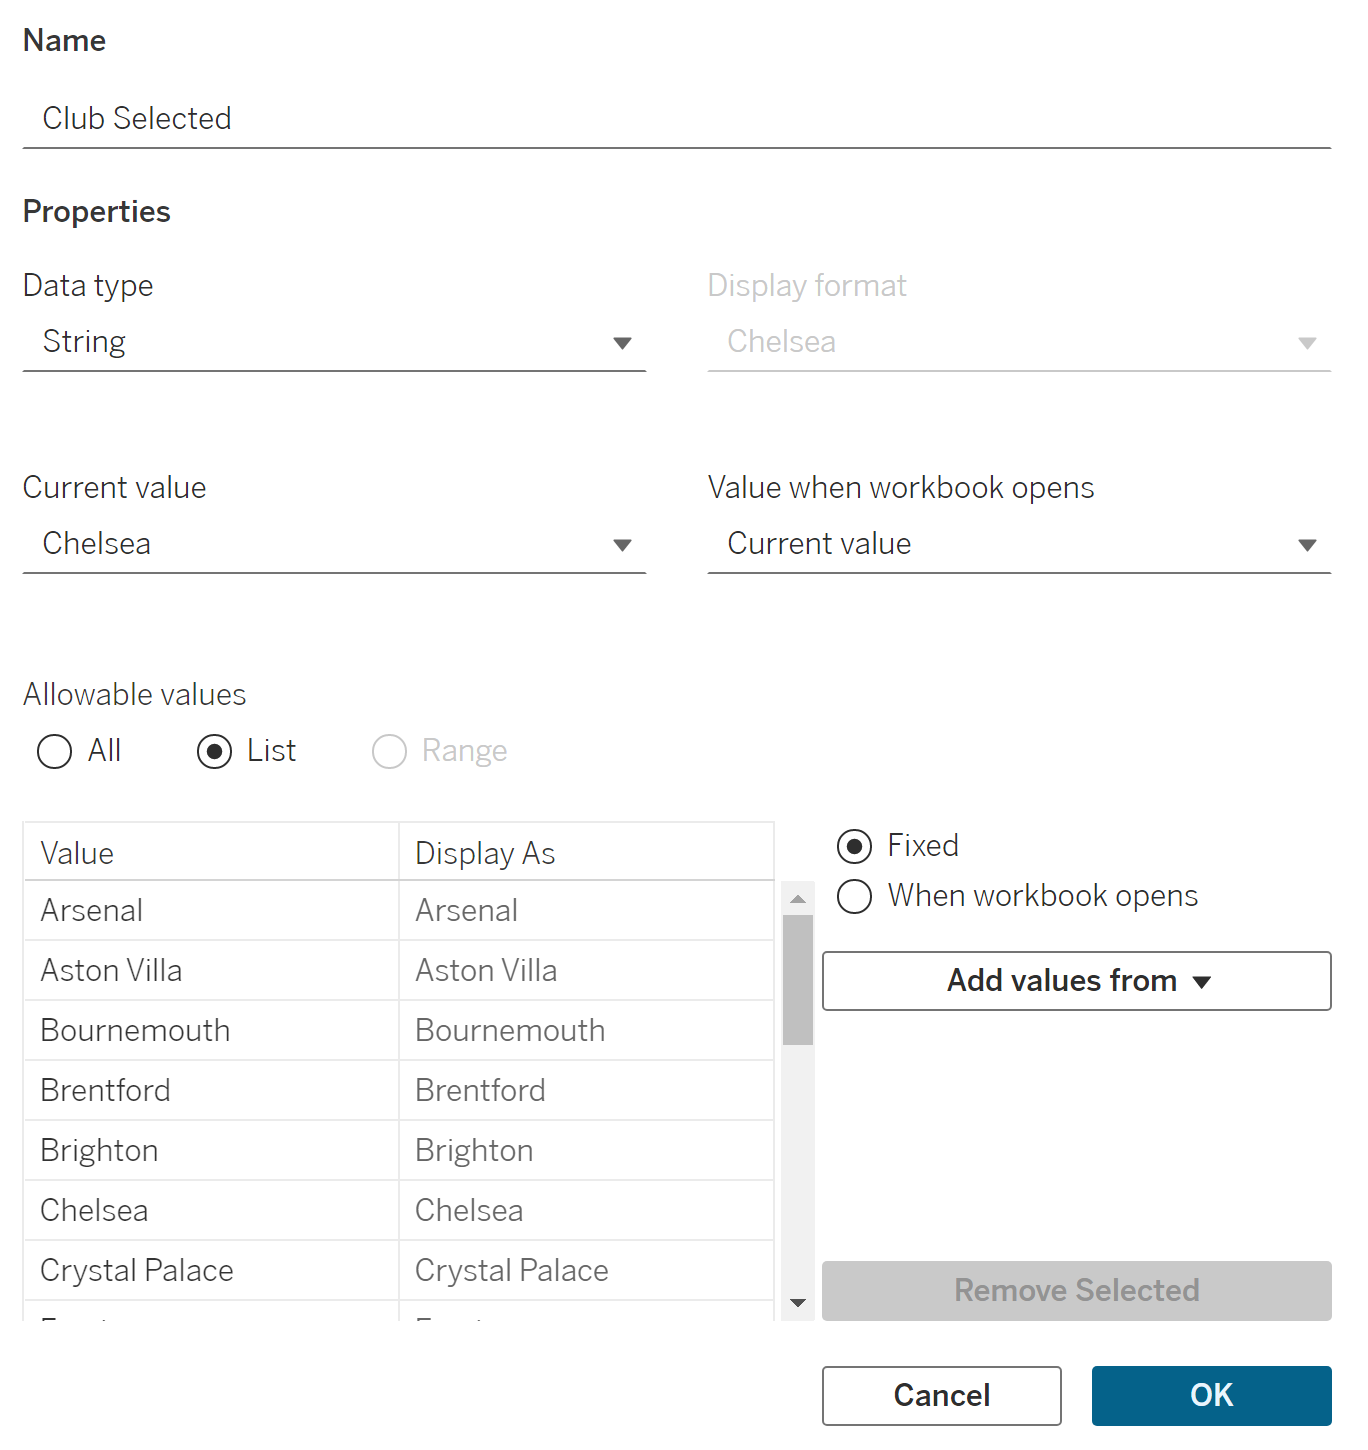
Step 1 - Create your parameter
We first need to create a parameter which has a value for each club. You can do this as an integer or a string - as long as the value is displayed as the name of the club.
You can use the "add values from" button to automatically add each club in as a value.
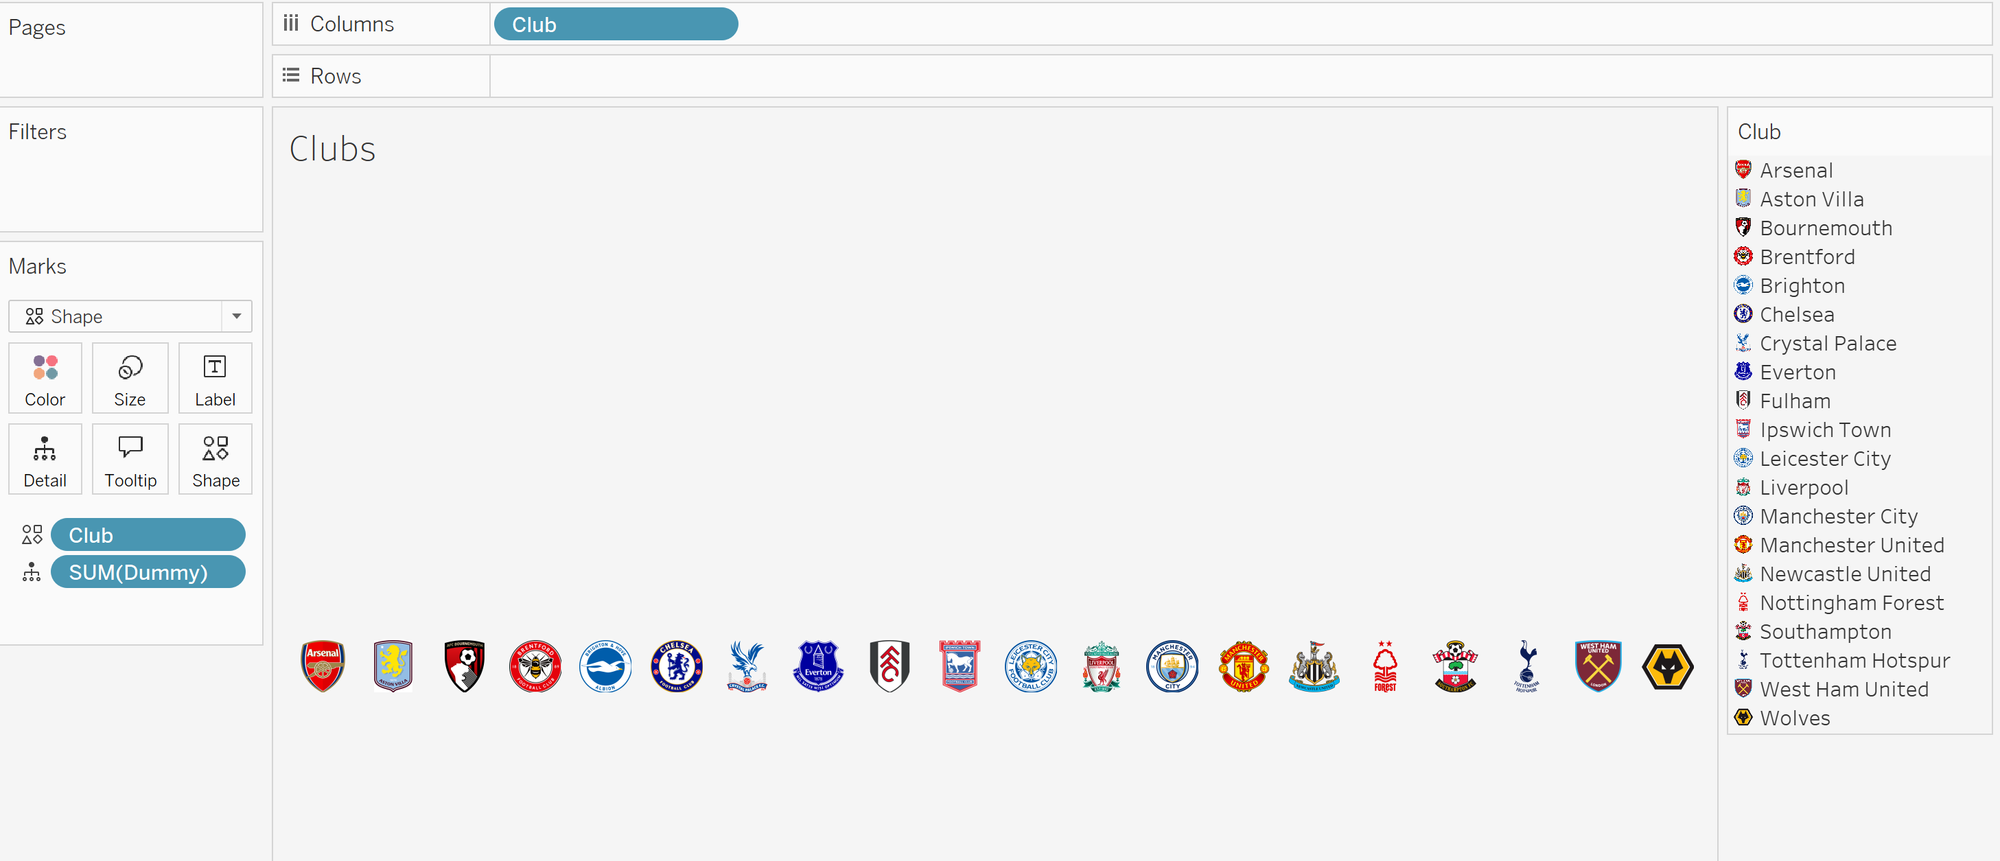
Step 2 - Create your buttons
In order to change a parameter with an action you need a corresponding value to click on. In our case we want to use the club as our "buttons".
Drag club onto rows and add it into the marks card as a shape. You can then click on "shape" and assign each club it's corresponding image.
To get the club logos (or any personalised image) in your shapes, you need to place each image within your shapes folder within your Tableau Repository folder. Once you reload Tableau Desktop, these images will be available in your shapes mark.
Step 3 - Link the parameter to your data
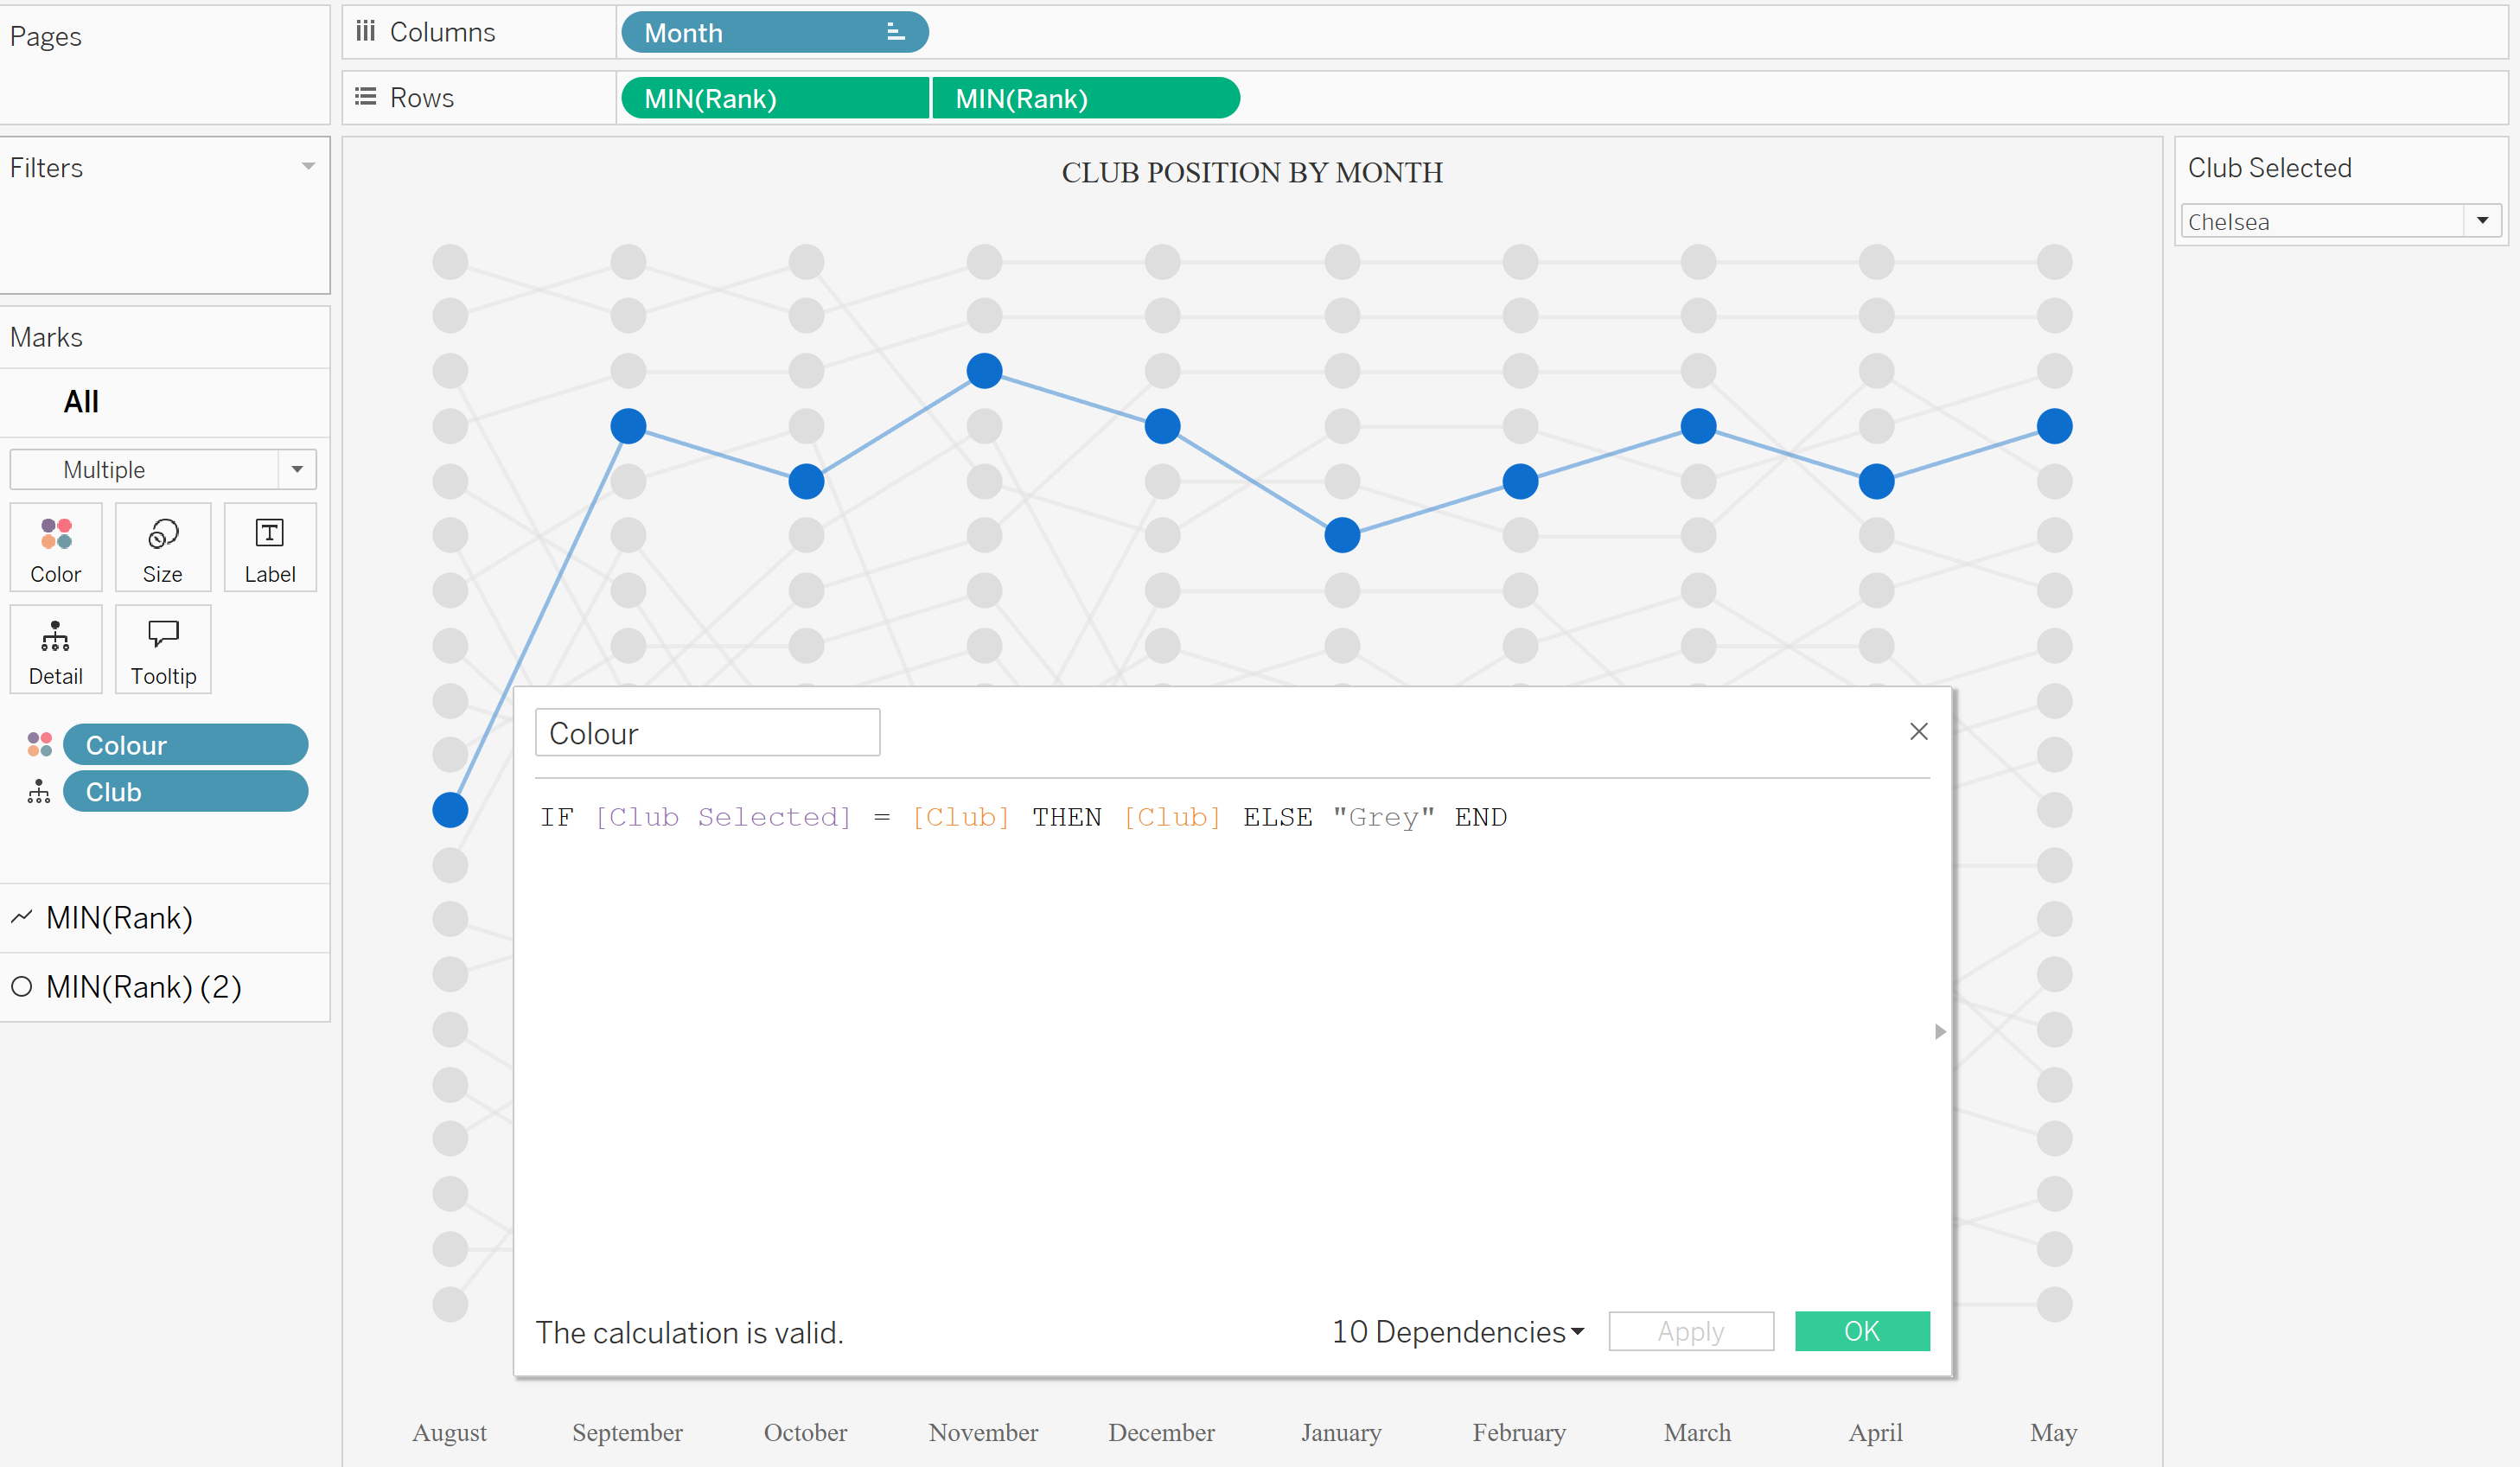
Link your parameter using a calculated field - in this case we want only the selected club to be coloured. This calculation ensures that the parameter is linked to the data, but is also colouring the selected club.
Step 4 - Set up your dashboard action
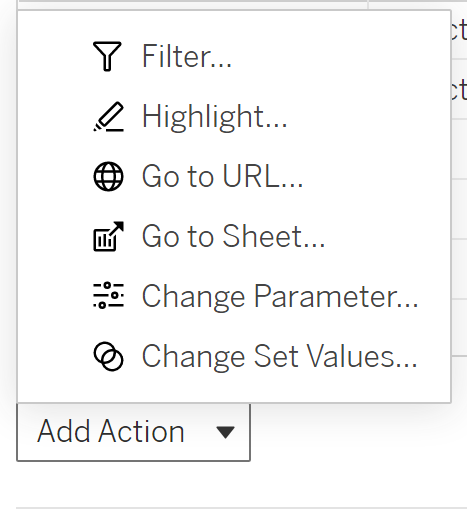
Within your dashboard, navigate to the dashboard pane and select "Actions..". Click on "Add Action" and select "Change Parameter".
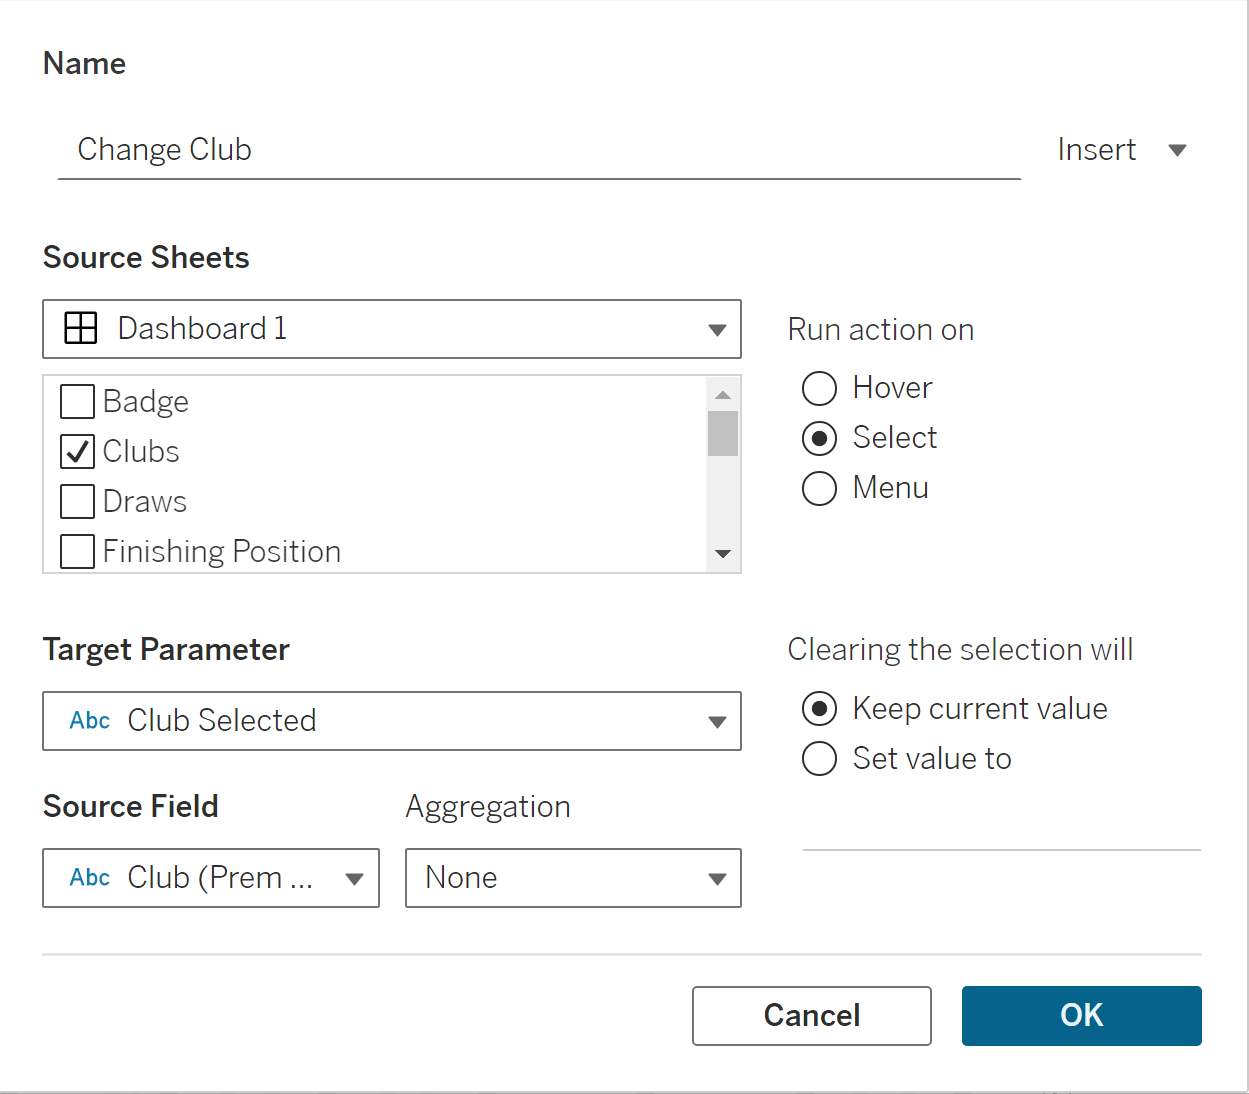
Your source sheet is what you want to click on to change the parameter. In our case the source sheet is "Clubs" as this is where all our club badges exist.
We want to change the parameter when we select a club so ensure your "Run action on" is on "Select".
Our target parameter is the parameter we set up to change the club - in this case it's "Club Selected".
Our source field is the field consisting of the different values we want to change - in this case it's "Club".
We want the club and it's corresponding data to change only when we click on a different club, so ensure "Clearing the selection will" is set to "Keep current value".
Step 5 - Test your action
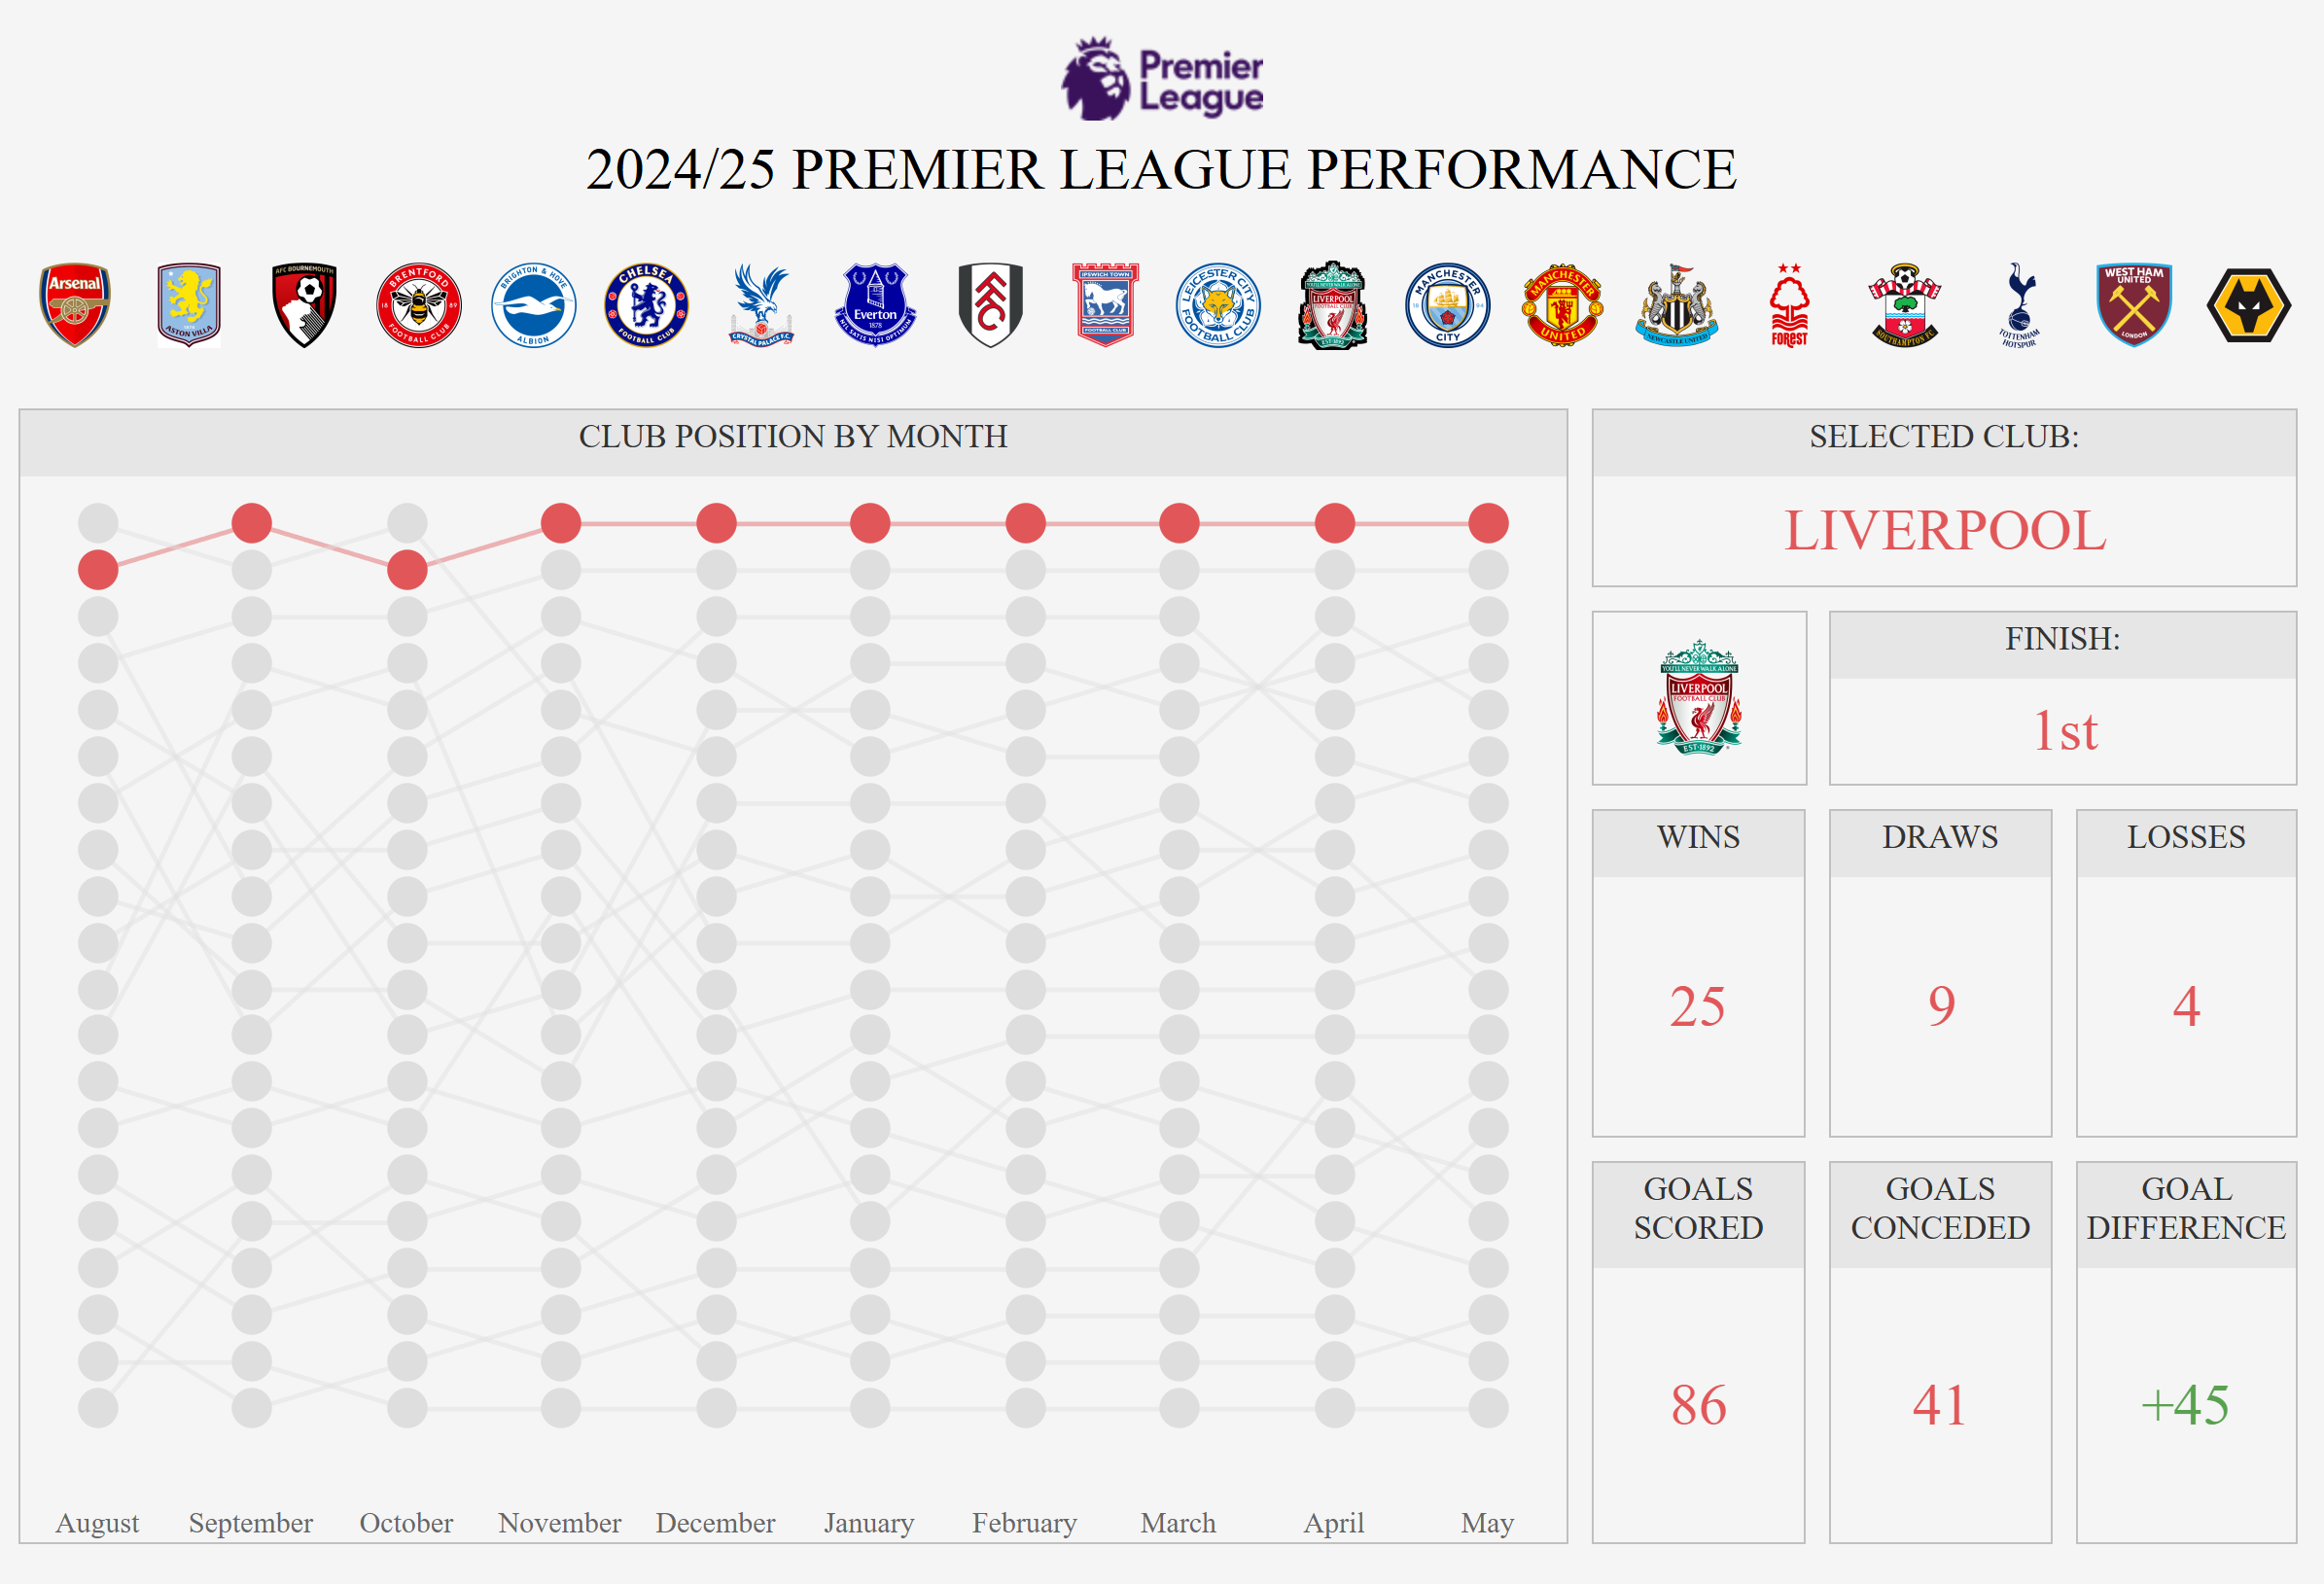
If you have both your buttons and your chart sheets in the dashboard, when you select a button it will now change the parameter to it's corresponding value. Due to the calculation we have set up in the chart, the chart will now also change to that value's specific data.
You can see below that if we select Liverpool's badge, the parameter value will change to Liverpool and therefore all the charts that are linked to that parameter will now also change.