


Tableau has this amazing functionality where it will build maps for you if you give it the right information. The Tableau map server already has data about the longitude and latitude values for multiple different geographic roles which you can read more about here:
https://help.tableau.com/current/pro/desktop/en-us/maps_geographicroles.htm
Recently, we worked on a project where the client wanted to see some information displayed on a congressional district map. However, the data did not include any latitude or longitude values - it only had the congressional district number in one column and the state name in another column.
Now, before you deep dive into the Net to try and find spatial files for the latitude and longitude values for each of these districts, Tableau has a very simple way to connect the state name and district number columns to map the correct locations.
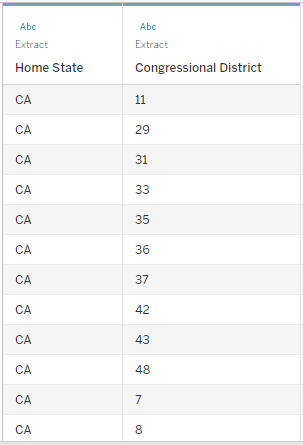
In the data set for this demonstration we have two columns - state abbreviation and district number. This data set does not include all the districts in all of the states, just in select states.
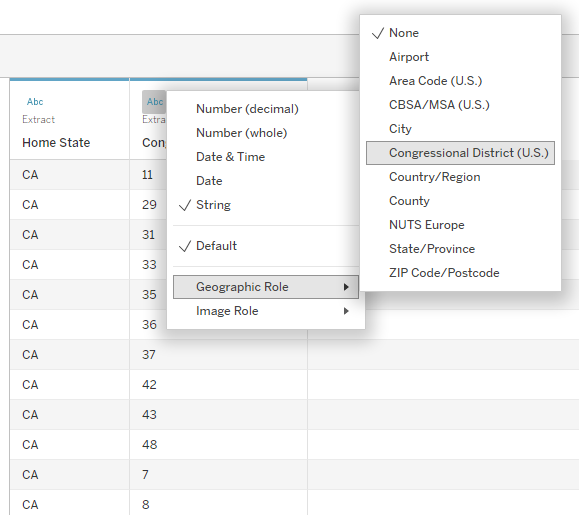
First, we need to change the geographic role of the congressional districts.
When you try to map the data as is, it will only give you a couple of districts in California.
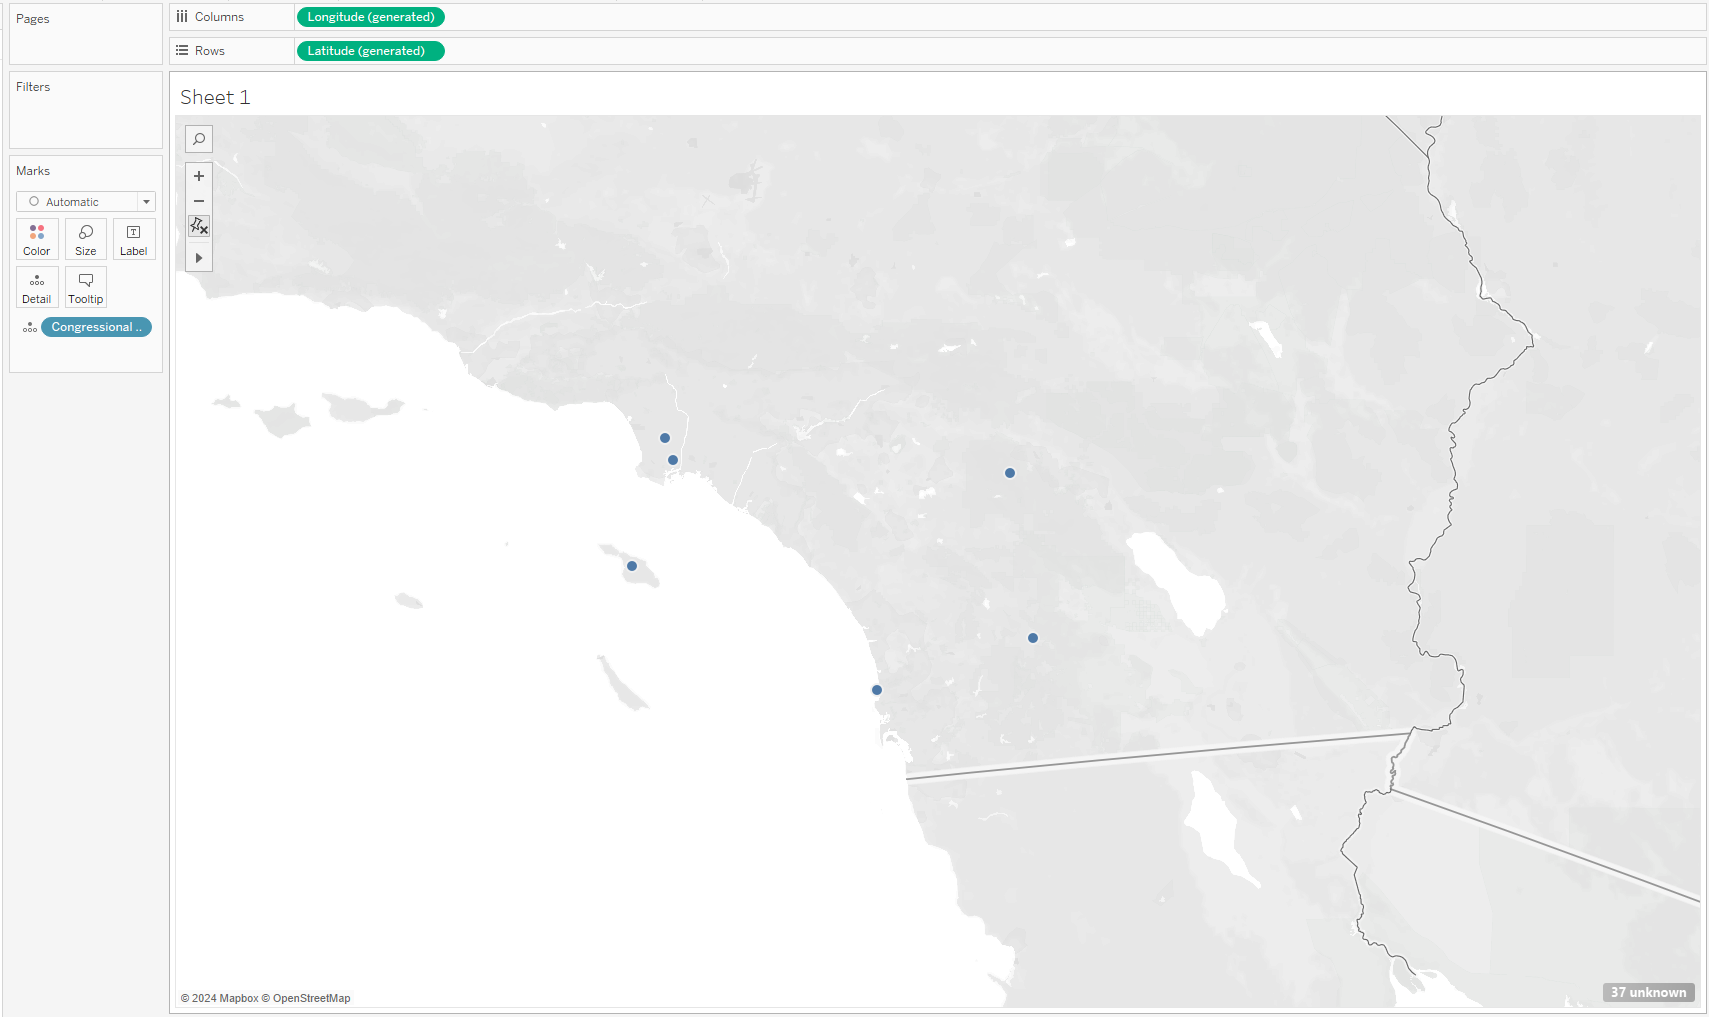
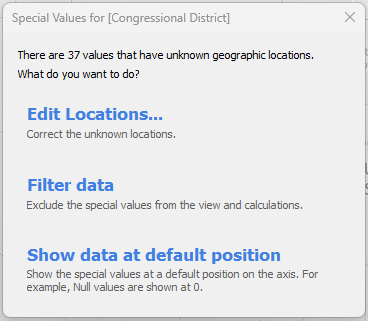
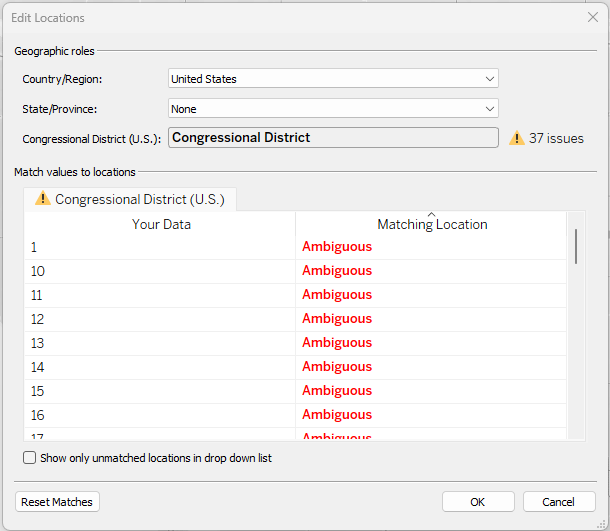
Notice the bottom right corner flagged 32 points as unknown. Click on the grey flag and a pop-up menu appears. Choose to 'Edit Locations'.

The next pop-up window gives you the option to connect the congressional district numbers to a state. Here you can also make sure Tableau is pulling information from the right areas. The Country/Region field is set to 'United States', and the Congressional District (U.S) field is set to the Congressional District field in the data source. The State/Province field is currently 'None' - this is where you connect to the state information in the data source.
When you select the dropdown menu, there are three options - keep it 'None', make it fixed on a specific state, or choose a 'From field'. In the 'From field' dropdown, select the state column.
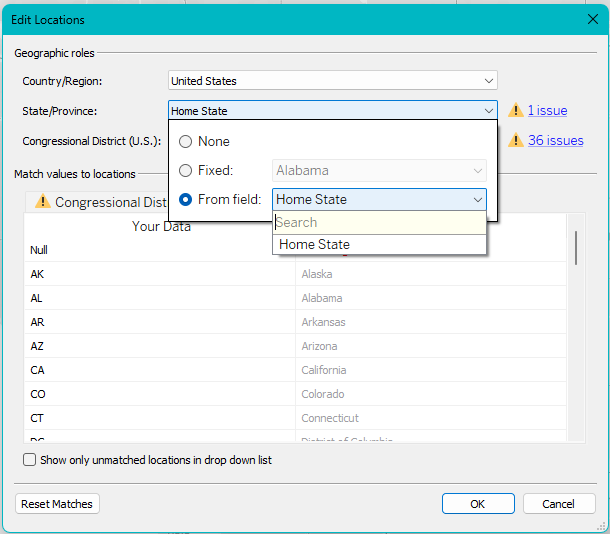
The warning signs that show next to the fields are caused by the null values in the data and would also be there if Tableau cannot recognize what you're trying to connect to (i.e. one of your state abbreviations might be wrong).
Notice that the map has updated to include 'Home State' on the details shelf of the marks card and the congressional district locations are now in all of the states included in the data set. Tableau has also automatically assigned a geographic role to your column with the state information.
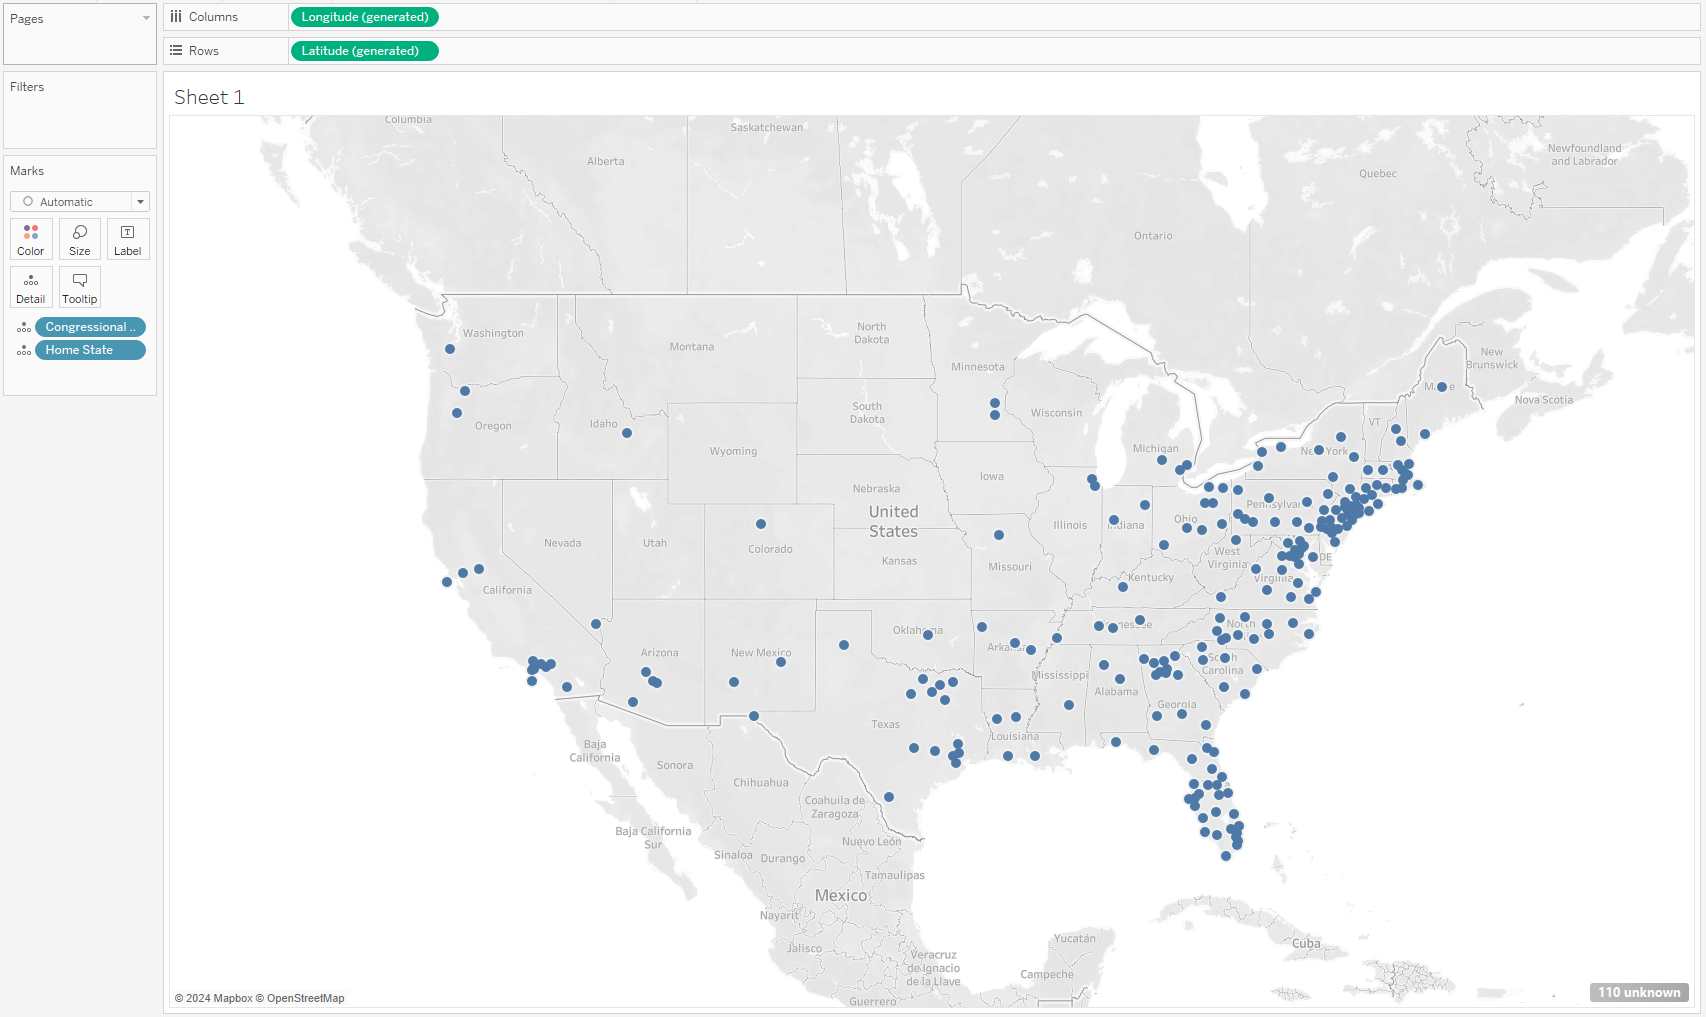
Alternatively, you can also assign a geographic role to the column with your state information and drag that pill onto the detail shelf of the marks card.
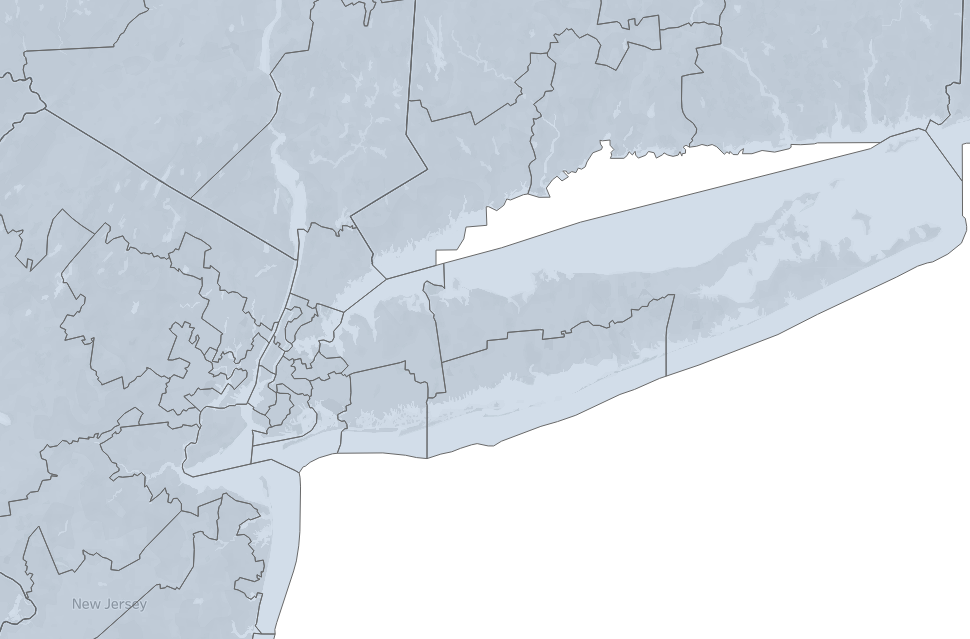
Notice that when you make it a filled map and look at the borders of each district it stretches beyond the map. This is just how Tableau created the latitudinal and longitudinal information in the map data.
Note: If the congressional district number and state were in the same column, Tableau would not be able to recognize that as a geographic role. You'll have to split your columns first and then do the process as mentioned above.