


With the use of parameters, we can switch between several measures all in one sheet. This can potentially eliminate the need for making more than one sheet for different measures but also add some wow factor in your charts or dashboard. In this blog, I am going to show how you can use parameters to switch between measures in one sheet.
For this example (using superstore data), lets say we want to switch between sales, quantity, and profit when looking at categories.
Step 1: Set up your parameter
Click on the caret icon, 3rd on the right from the search on the data pane and select create parameter. We'll name this parameter 'Measure Parameter' --> Change Data type to string --> Select List on Allowable values --> Manually type in Sales, Quantity, Profit in the value column.
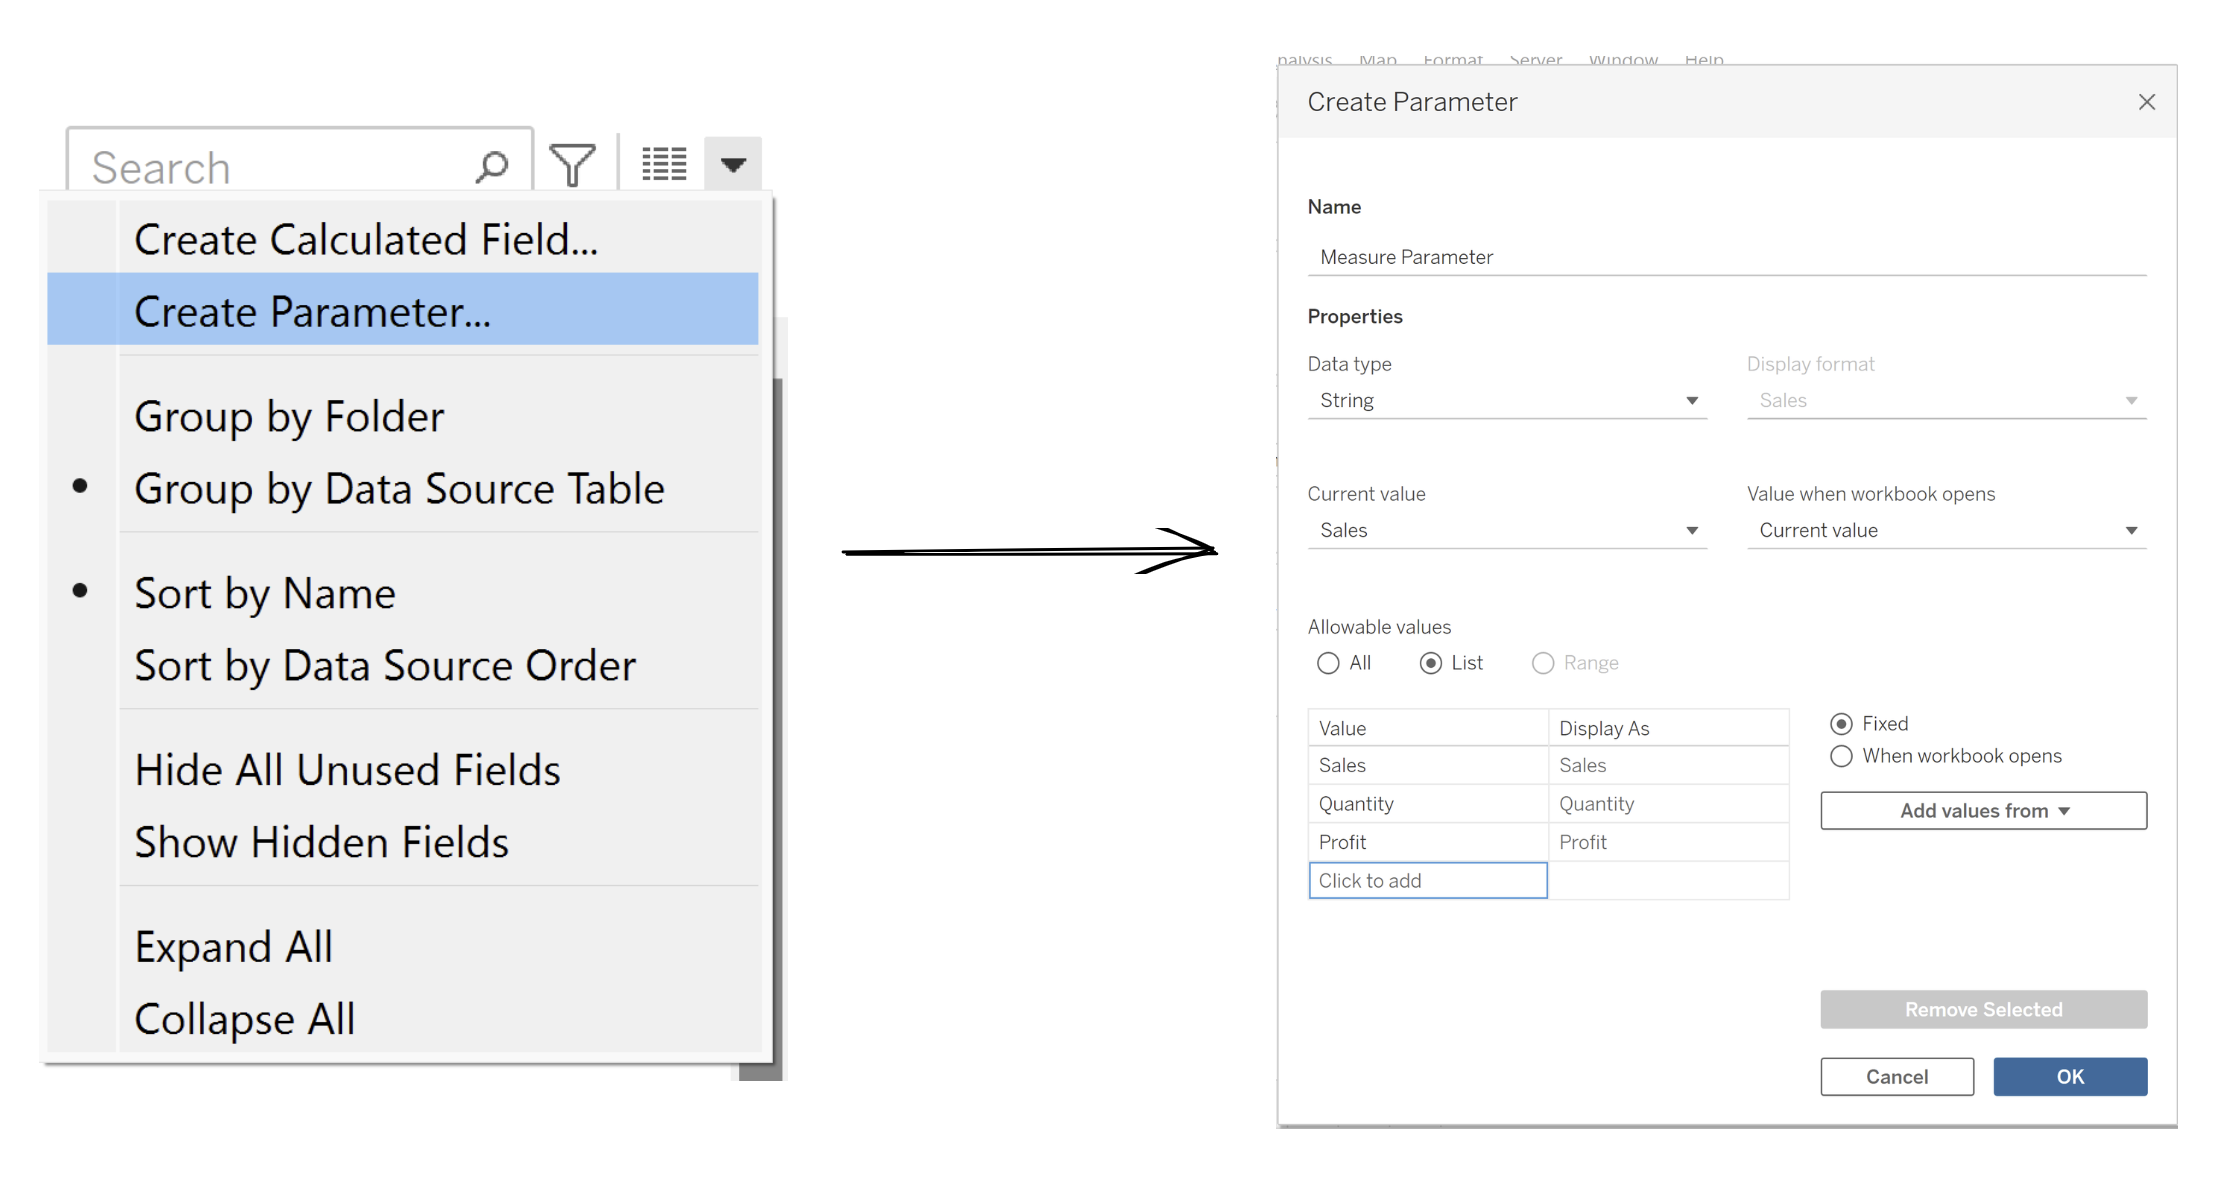
IMPORTANT NOTE: Ensure the measures you are using for the parameter are typed in exactly the as the named measure field in your dataset underneath value - i.e. it is case sensitive, otherwise the parameter won't work for that measure.
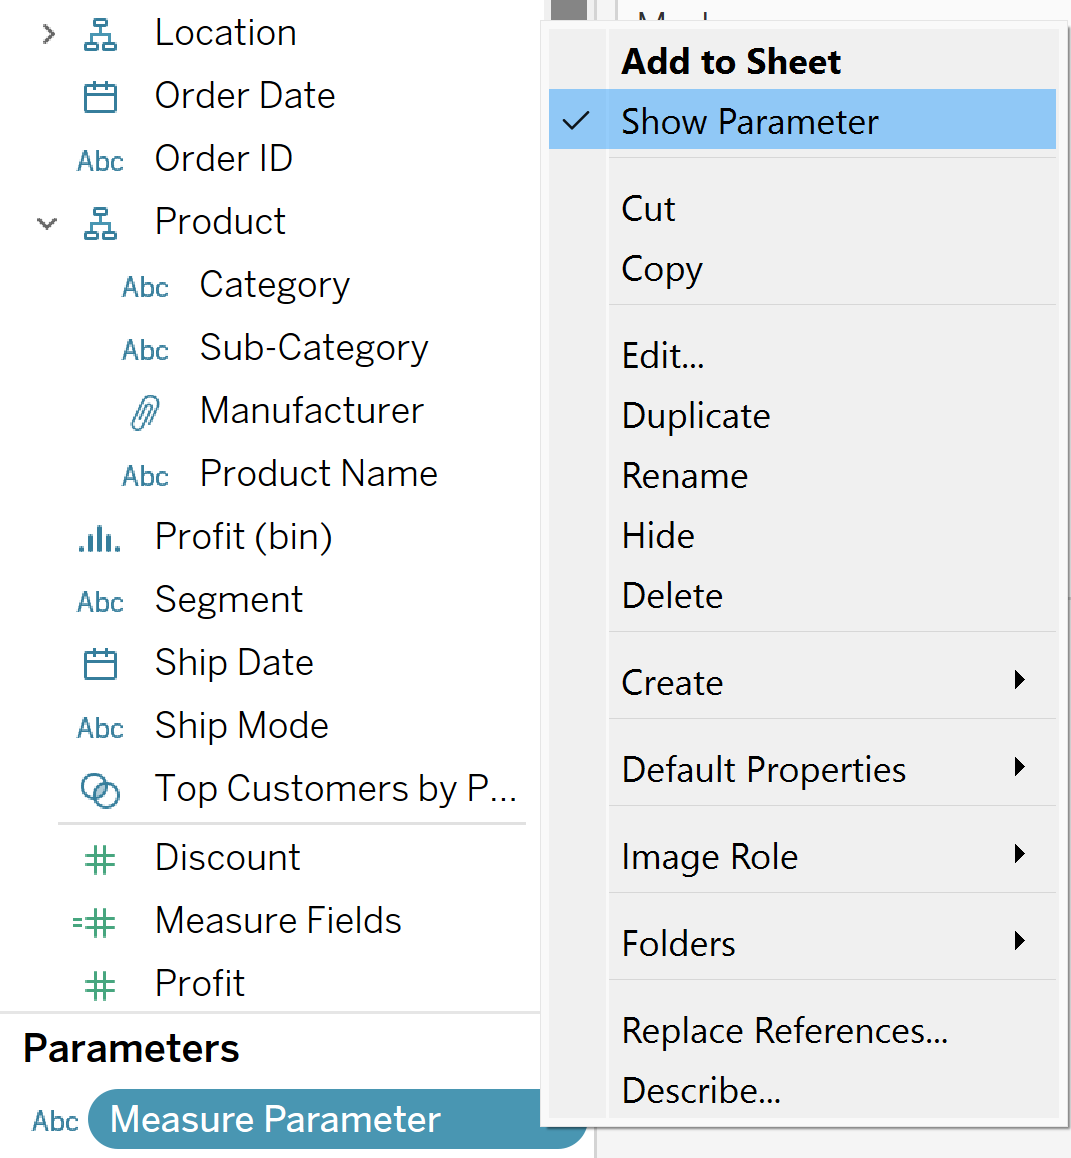
Parameters are always at the bottom of the data pane. Right-click the parameter we just built and click show parameter.
Step 2: Putting the parameter into a calculated field
Parameters won't work unless placed into a calculated field. So for measure swapping, the calculated field is generally a CASE function. A CASE function is essentially a big IF statement function. The calculation and syntax is as shown. Lets name it 'Measure Fields'.
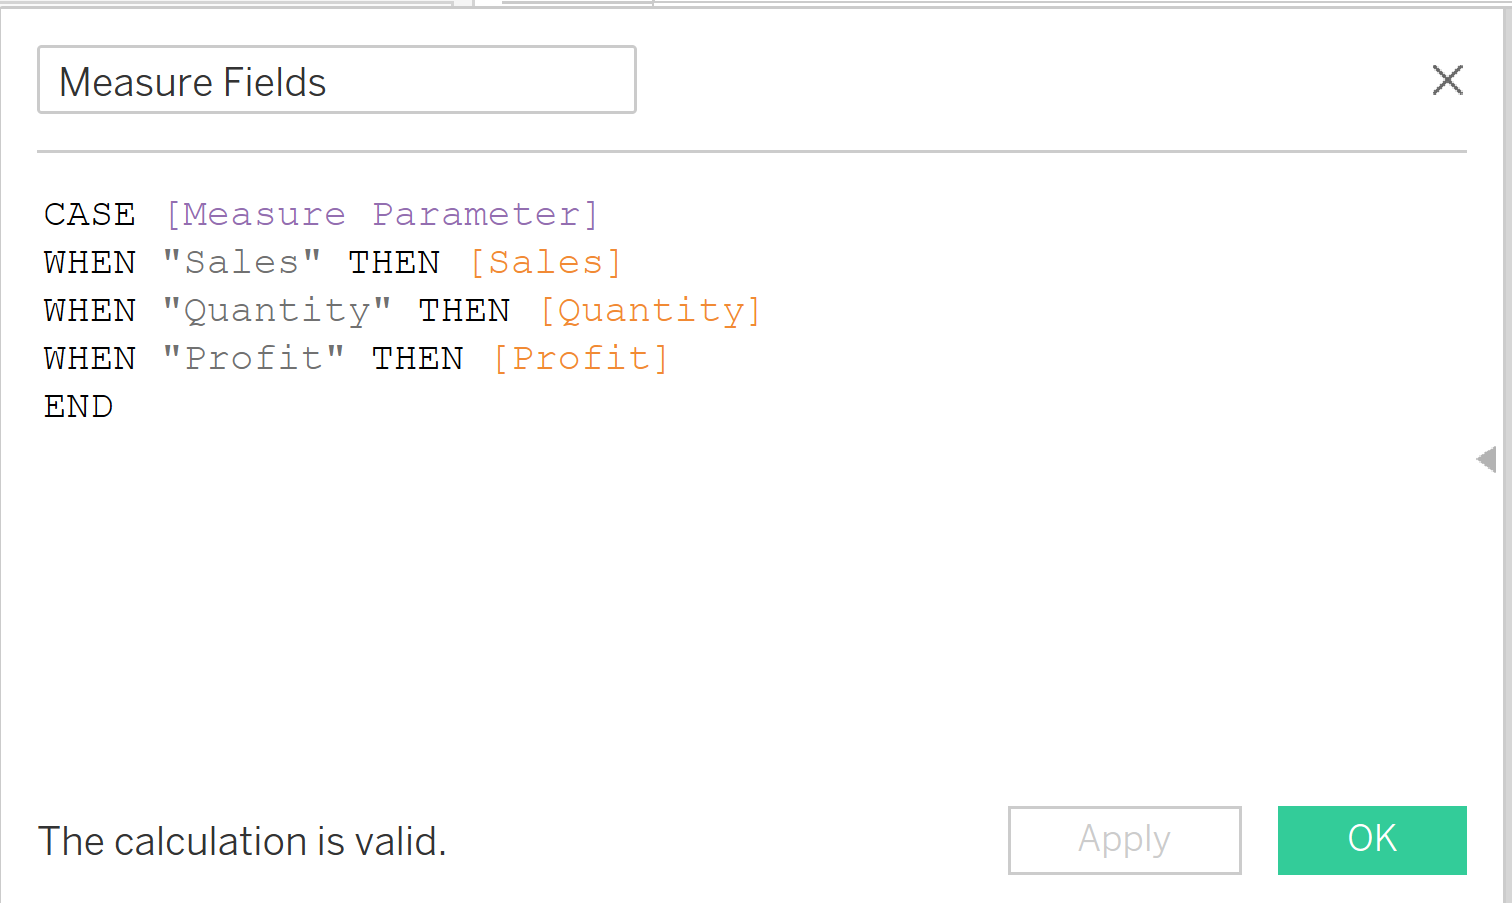
So you plug in the measures you typed in your parameter in quotations or speech marks then return the measure you want from it. As mentioned, CASE functions are basically IF statements so don't forget the end function at the end.
Step 3: Building the chart
Now that we have our parameters and calculated field built, we can now start to build the chart. Drag Category on to rows and drag the 'Measure Fields' calculated field we made on to columns.
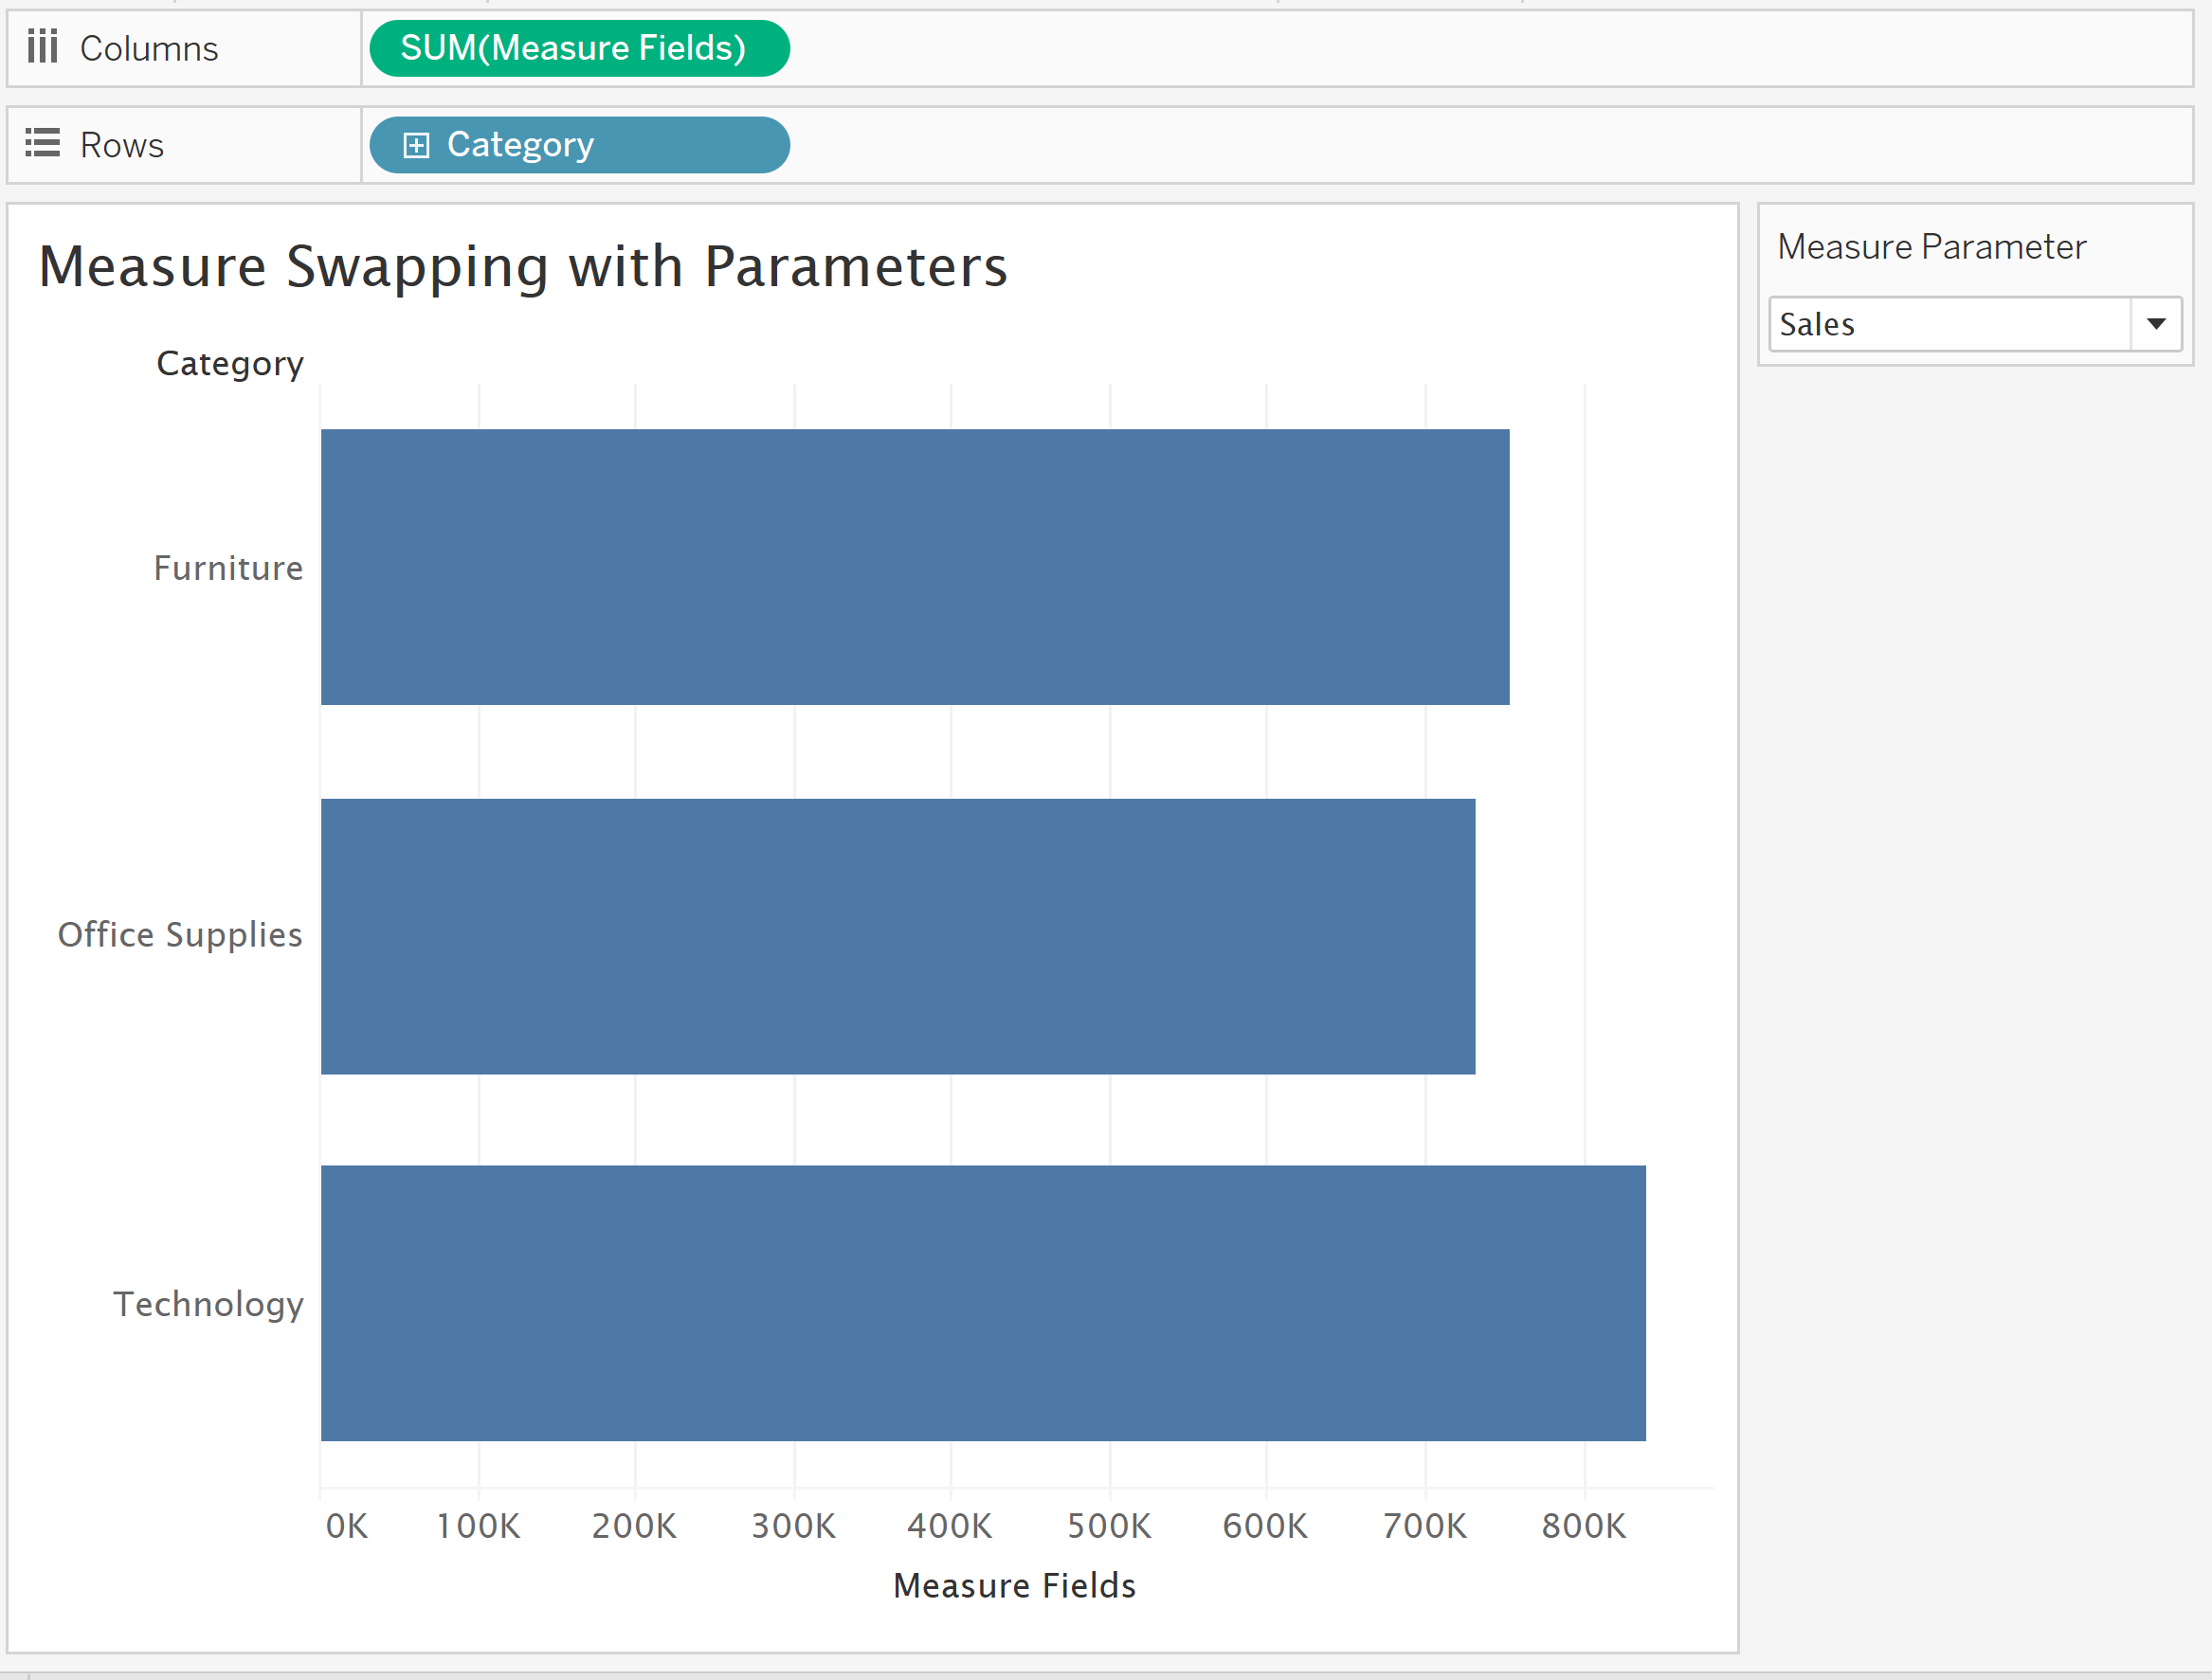
Step 4: Adding the parameter to the title
This last step is optional, but you can add the parameter to the title to show even more clearly which measure is in the view right now. When you go to edit the title, click insert and select the parameter we built at the bottom.
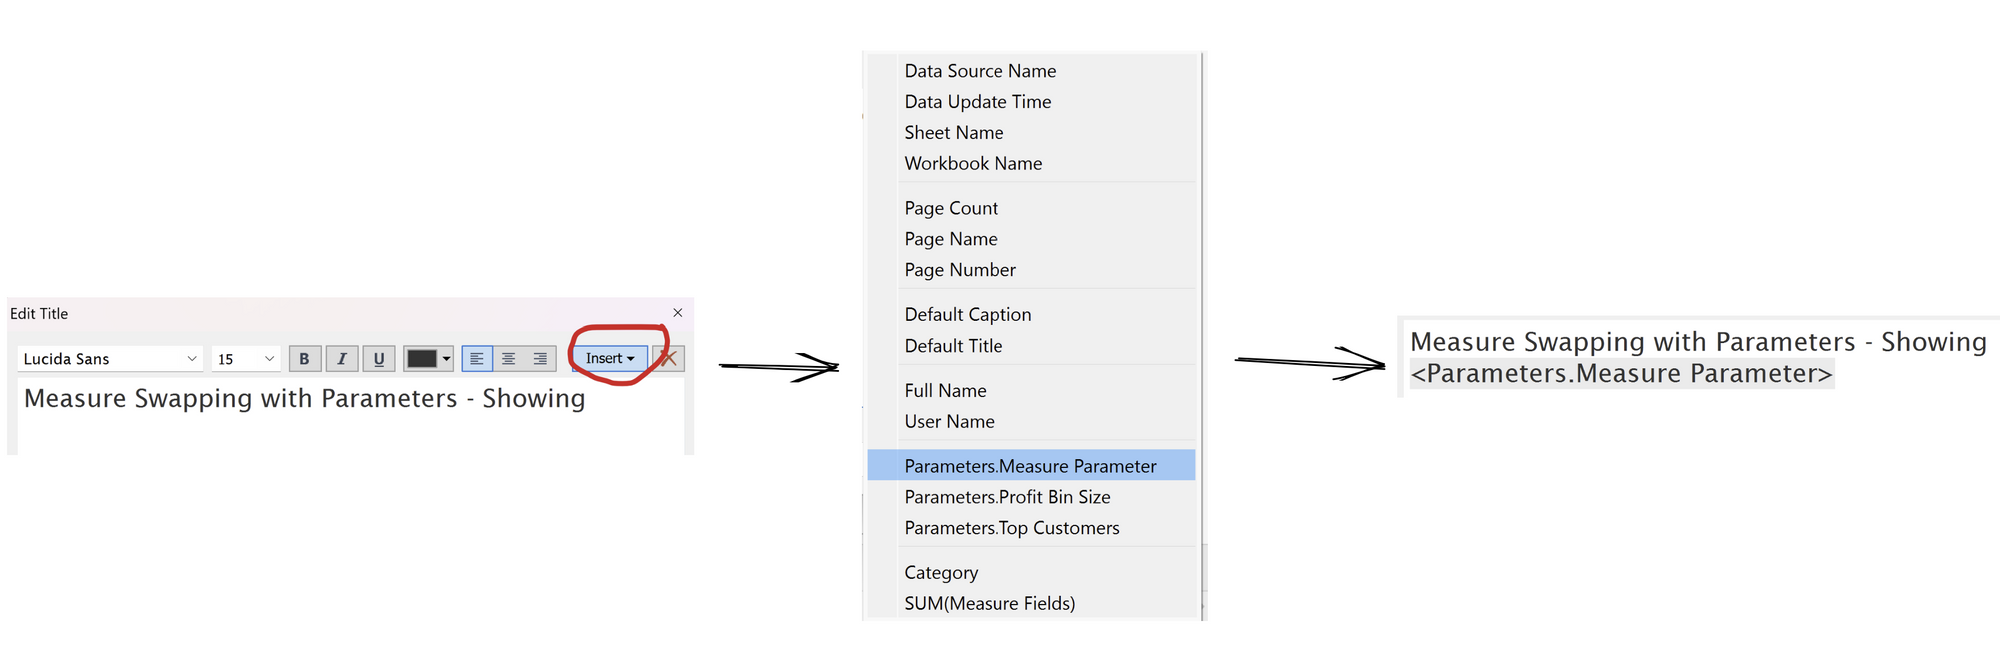
Which should then leave you with the following final results:
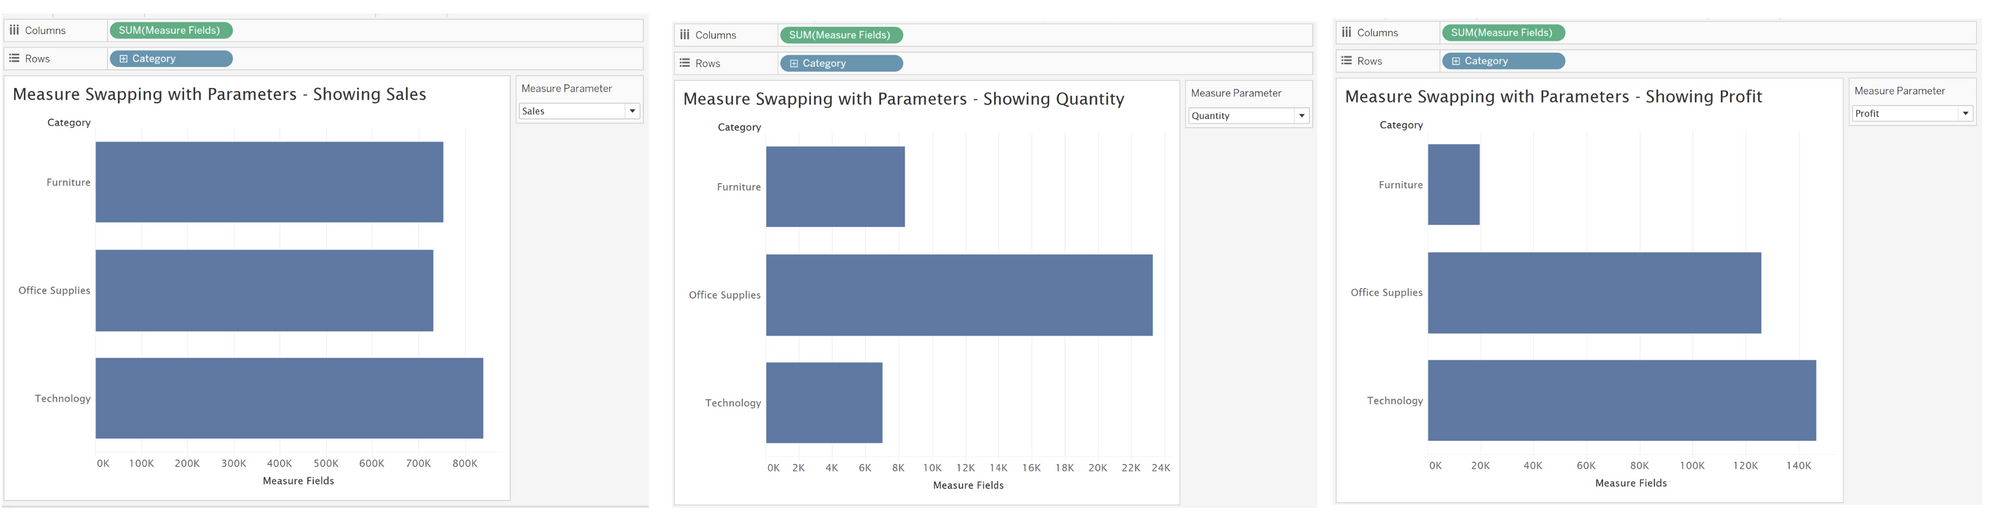
Hopefully this blog will allow you to create a swapping measure parameter with your own specific or desired measures.