


Table Calculations and LOD's can be very useful for providing extra analysis with your data. In this blog, I will briefly show you how these techniques can be performed and what you can do with them.
Table Calculations
Table calculations are used to perform calculations with the fields and measures in your view already. For example, let's say you want to find the percent of total sales of each category per year. Using the superstore data we drag the order date to columns and sales into rows. Drag category into color. Change the marks into bars instead. Feel free to change the graph to entire view or not, depending on your preference. It should look as shown below.

Now to do the table calculation, right-click sales --> hover over quick table calculation --> click percent of total. To complete the table calculation, you're going to right click sales again and hover over 'compute using' and select category. The video below highlights these steps.
Now I'm going to (try) to explain what goes on in the behind the scenes for table calculations. If you go back and right-click sales and click edit table calculation you should come up with the following menu.
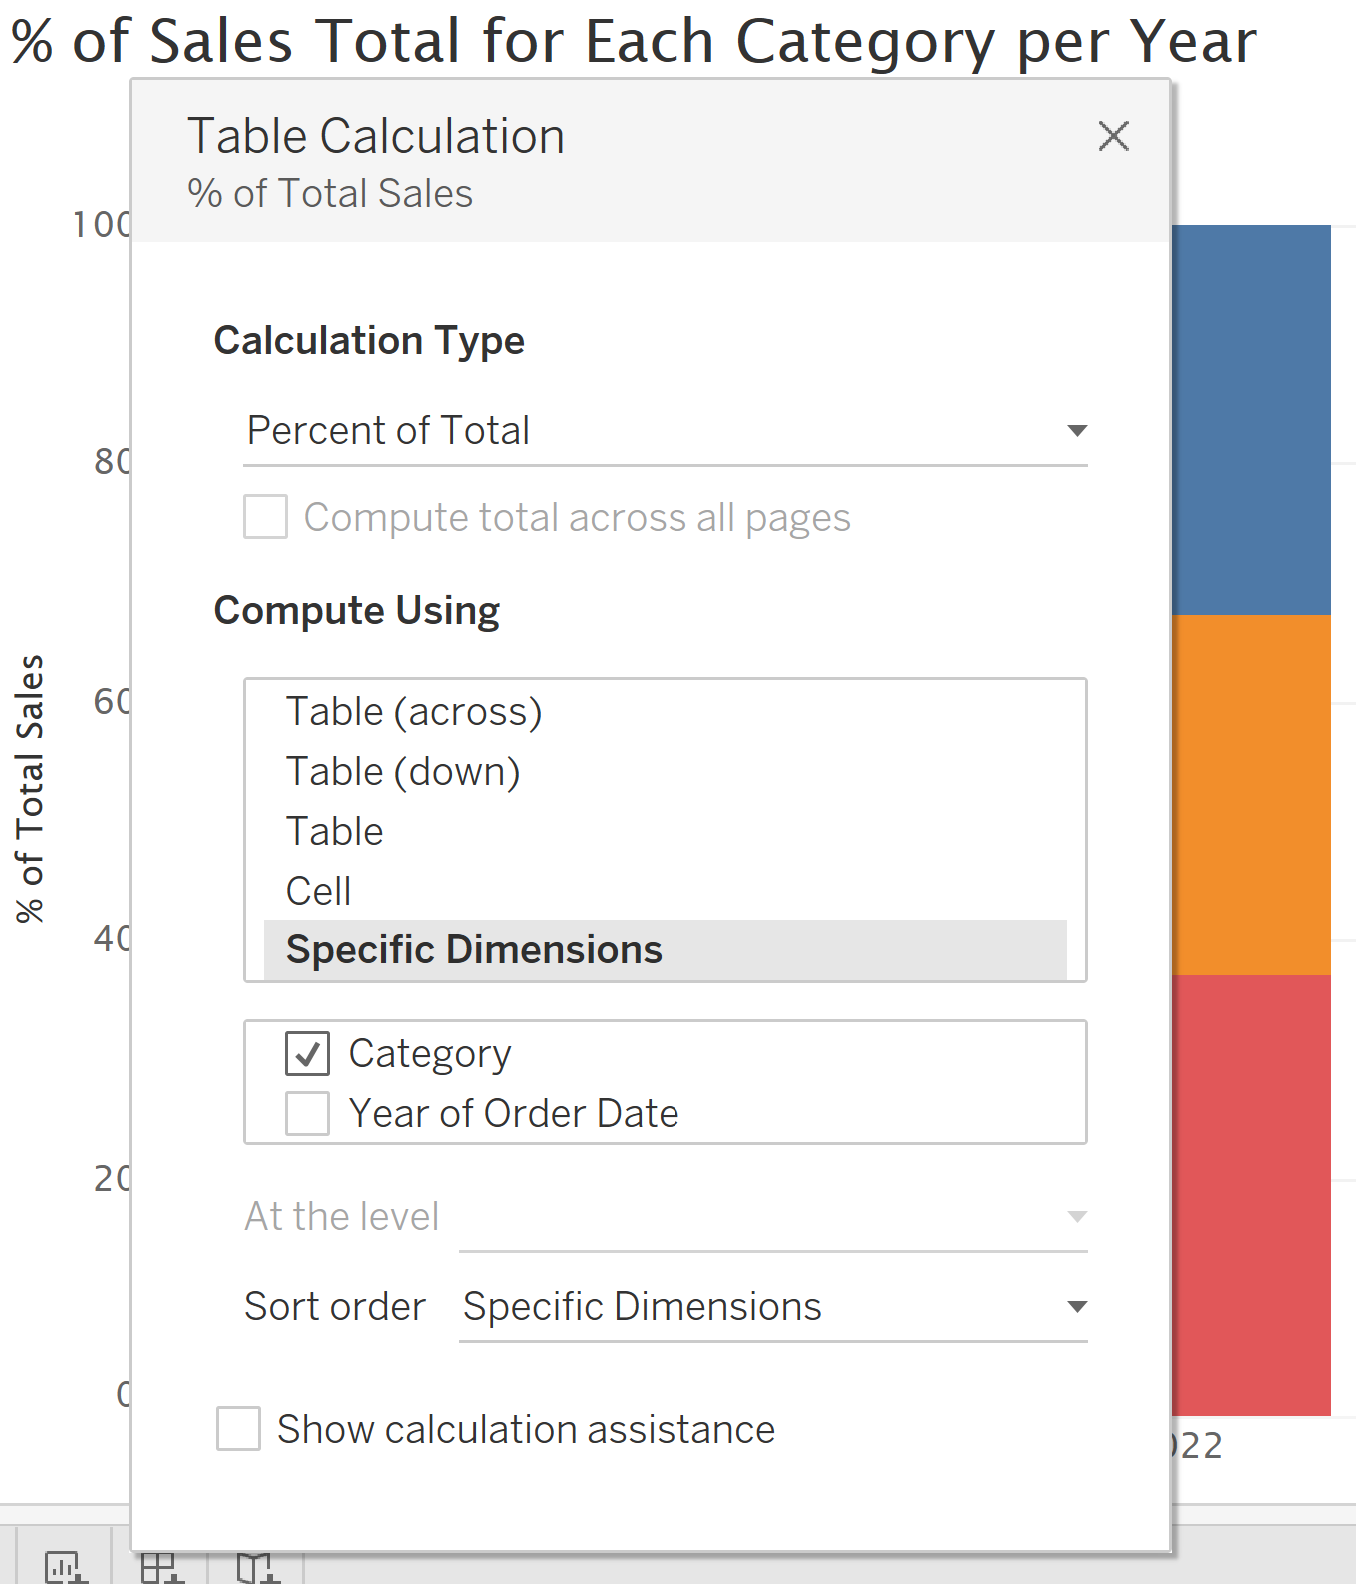
So you can see the calculation type as well as the different types of how this table calculation is performed. All of these compute using options are based from the specific dimensions in the view to create your graph, in this case it is category and year of order date. You can click on each option and the specific dimension boxes will change depending on what is selected - the default option is table (across). A general rule for the specific dimensions is that the table calculation will be calculated by ticked per unticked. In this case the percent of total sales (table calculation) is being calculated by category (ticked) per year (unticked). This can still apply when working with multiple dimensions so be careful with the logic when there are many dimensions.
As shown in the video, you can do many types of table calculations such as running total, difference/percent difference from, ranking etc.
LOD's (Level of Detail)
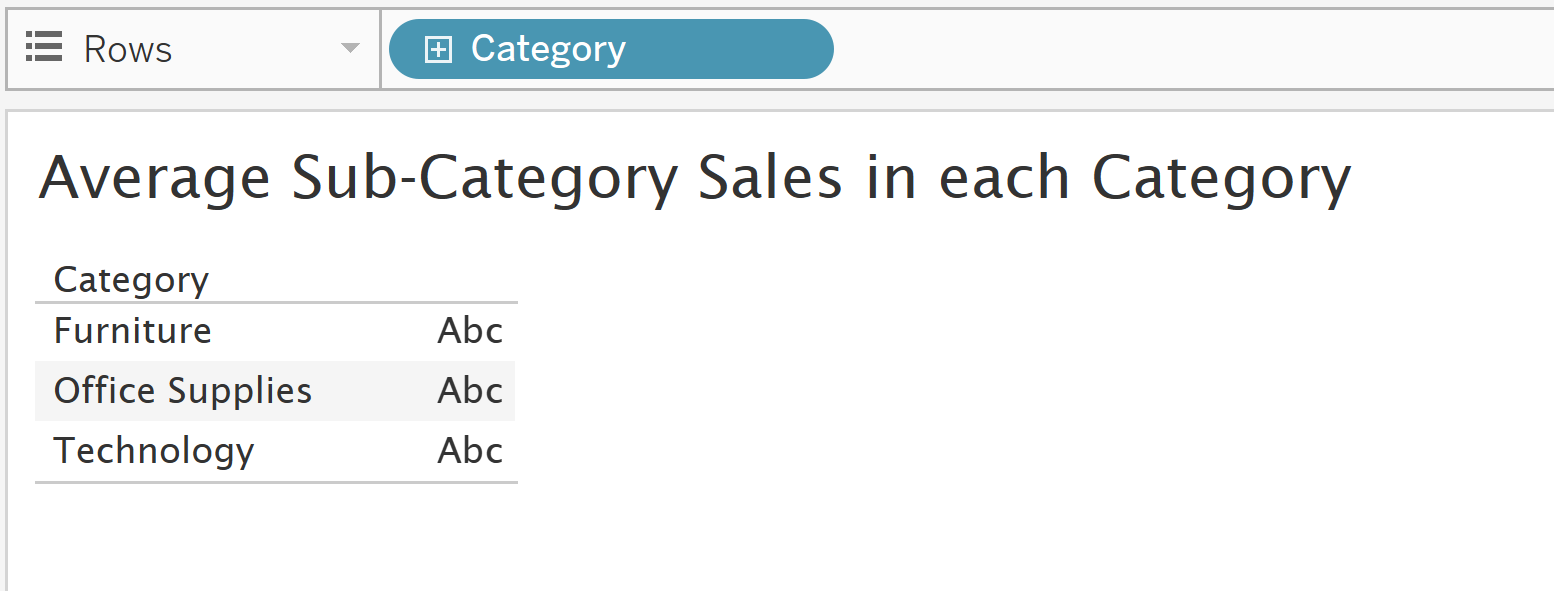
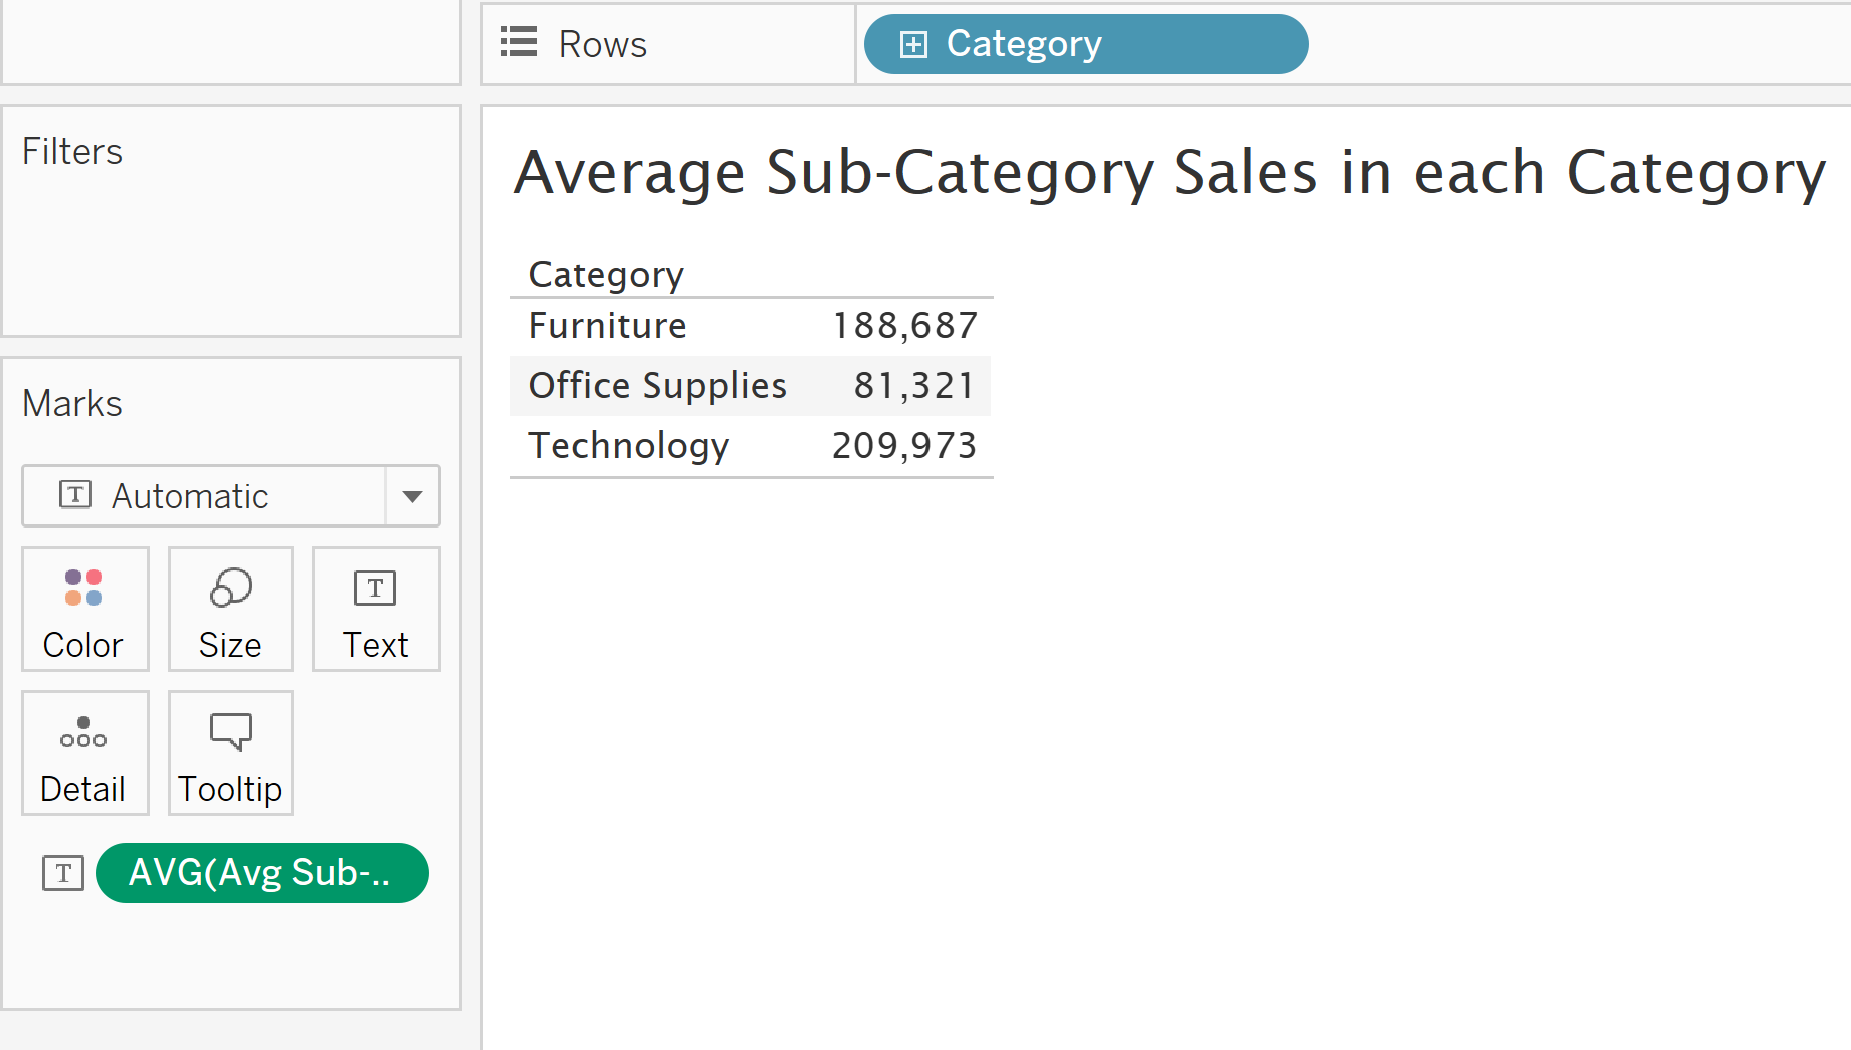
Level of Detail calculations on the other hand are generally used when working with a different granularity not shown in the view. What this means it allows you to perform calculations at a data source level, so you don't have to bring everything into the view. For a simple example, let's say you want to find the average sub-category sales for each category. As mentioned LOD's are for calculating at a granularity not shown in the view. In this case that granularity is sub-category, so in this case only category is brought into the view where we can place it in rows.
So to perform the LOD calculation, we simply create a new calculated field and the syntax/calculation for this example is shown below.
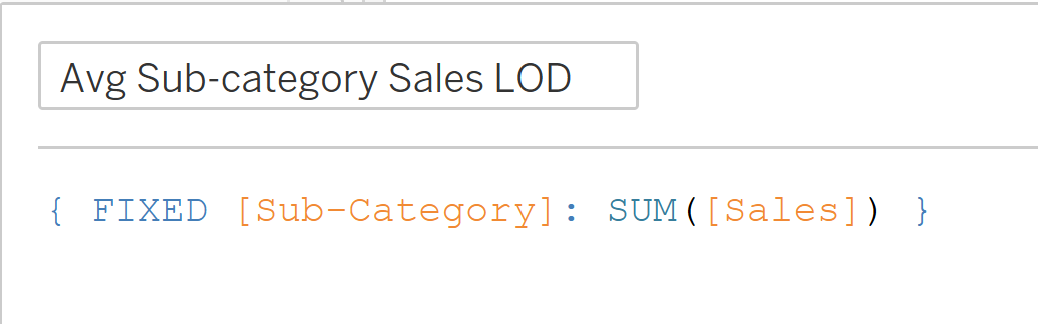
Since we're focused on sub-category which is not in the view, the FIXED function forces the calculation at this granularity only. All LOD calculations must be aggregate. To complete this example, we drag this calculation into text and change the measure into average.
You can change it into a different mark for visualization purposes but this example was to get an idea how to perform an LOD calculation and what they are. FIXED isn't the only function for LOD calculations, there is also INCLUDE and EXCLUDE but that is for a later time :)
Hope this blog helped in understanding table calculations and LOD's.