I would like to build a worksheet that contains either bar chart or line chart by choosing the chart type.
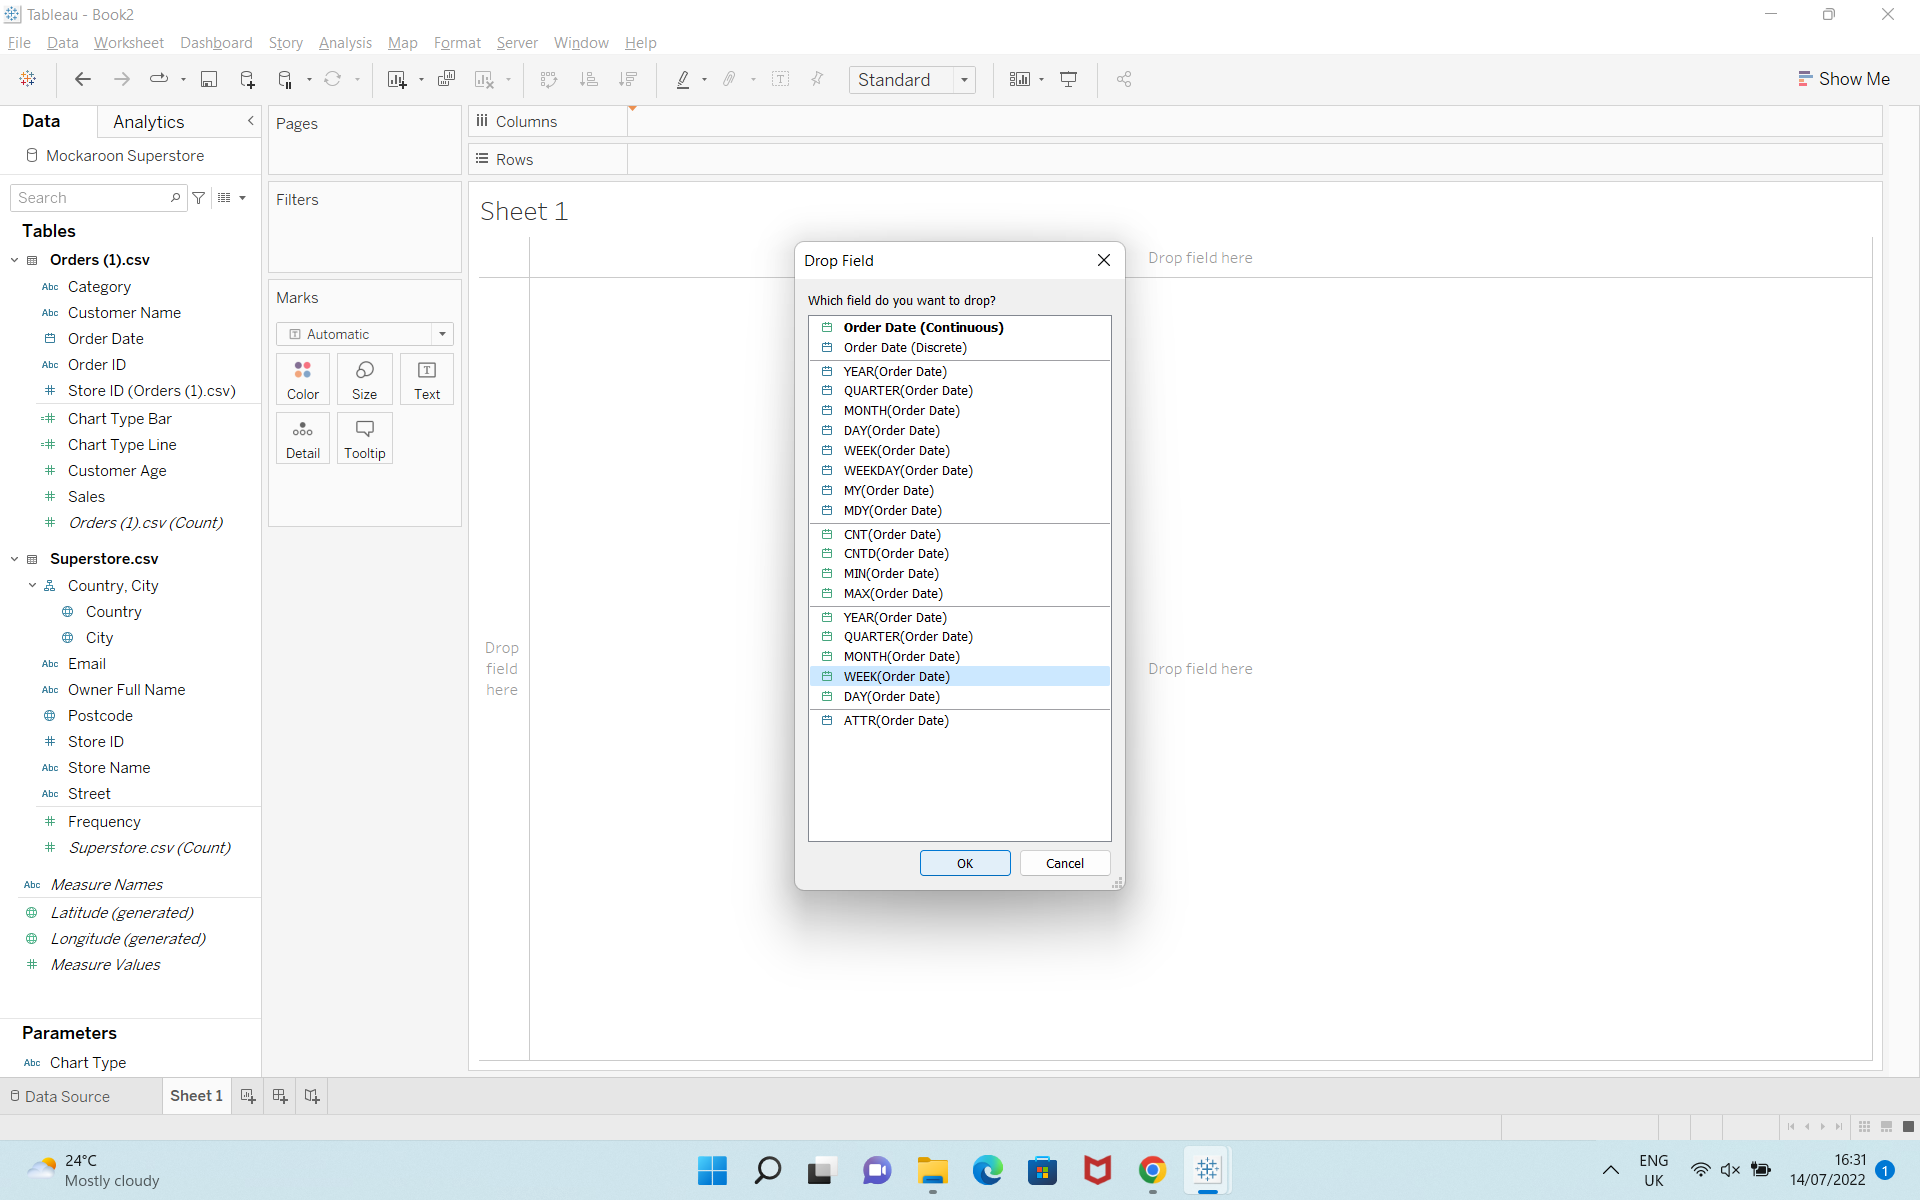
Firstly, right click Order Date to the Column and choose the continuous WEEK(Order Date) and click OK.
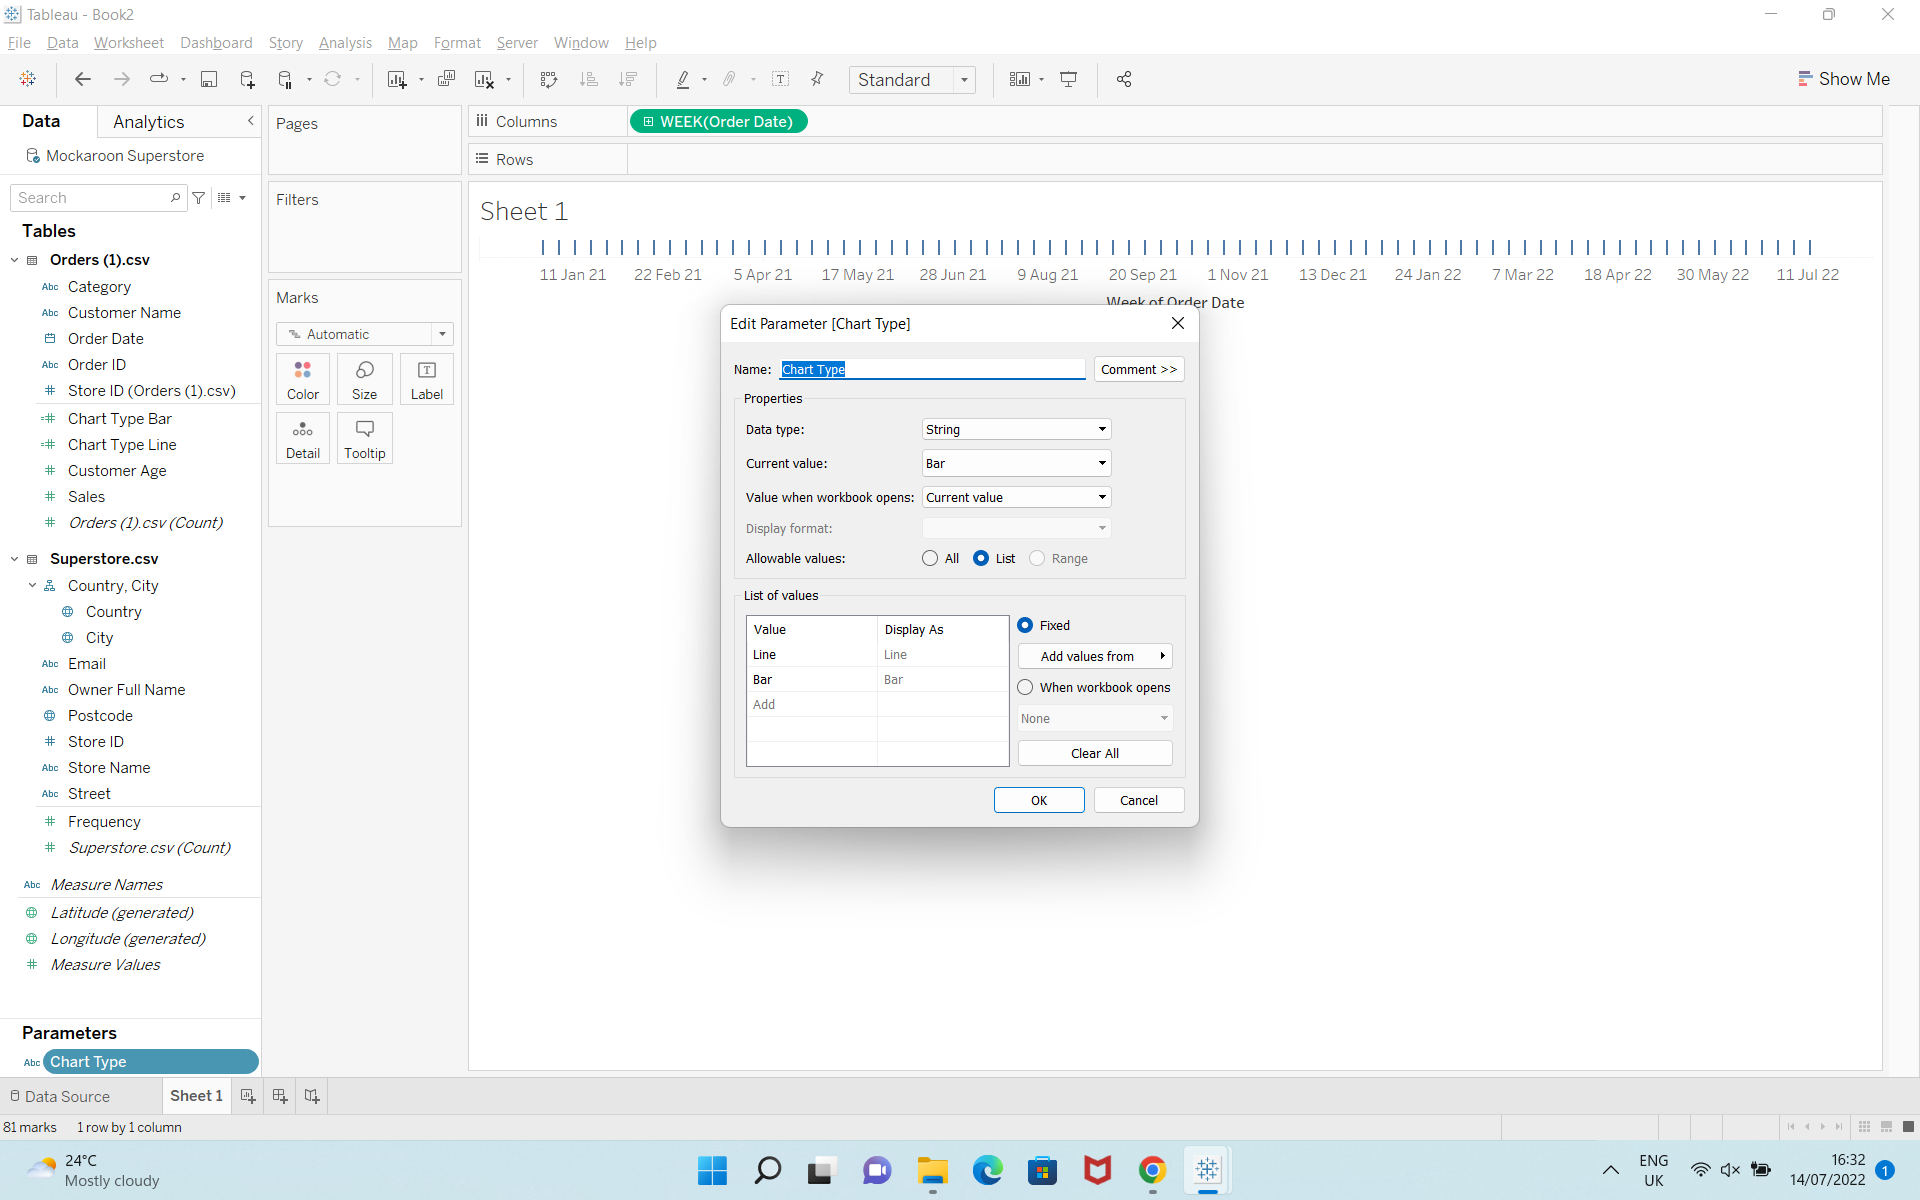
Secondly, Create Parameter called Chart Type. The information filled out as below. I made it already, so I clicked the parameter and chose Edit to show the detail information.
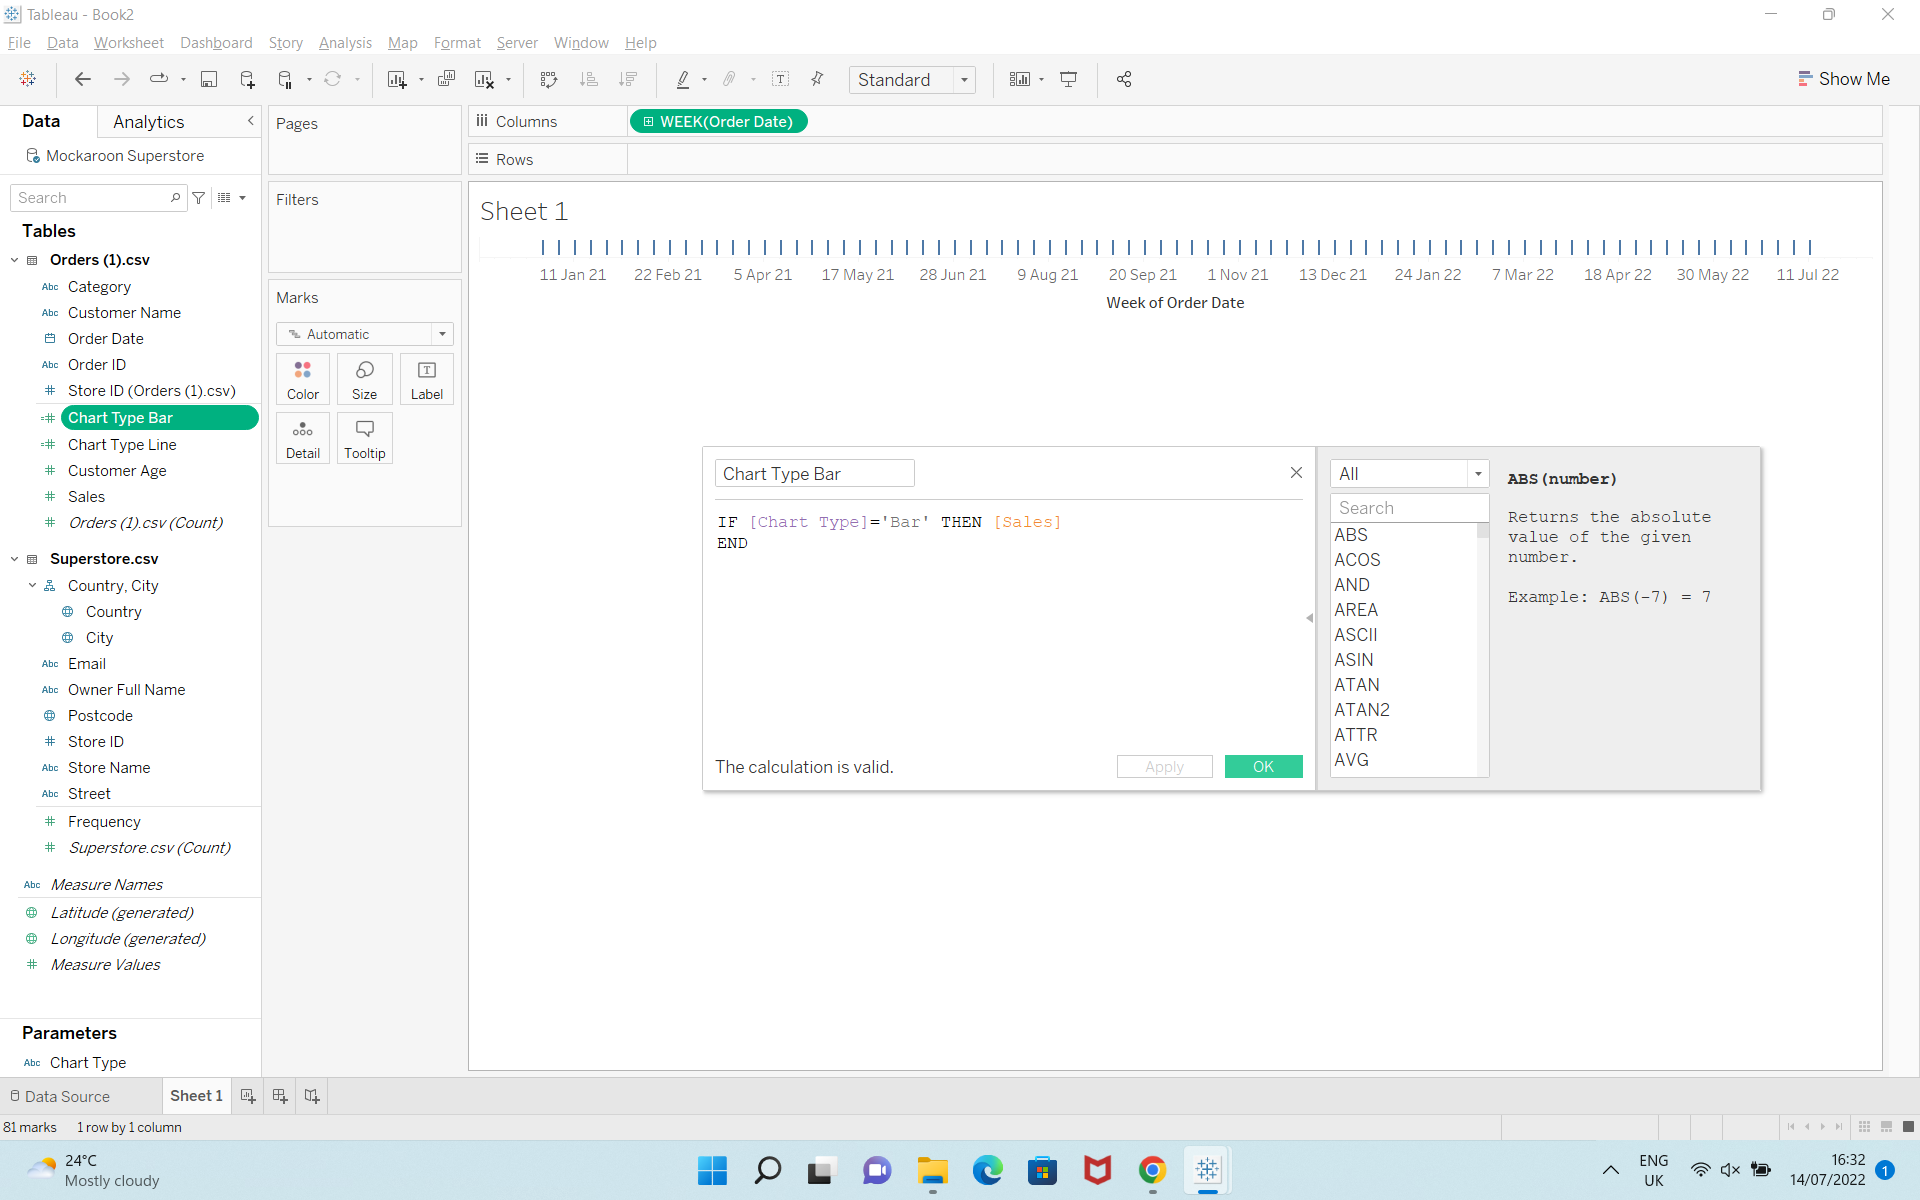
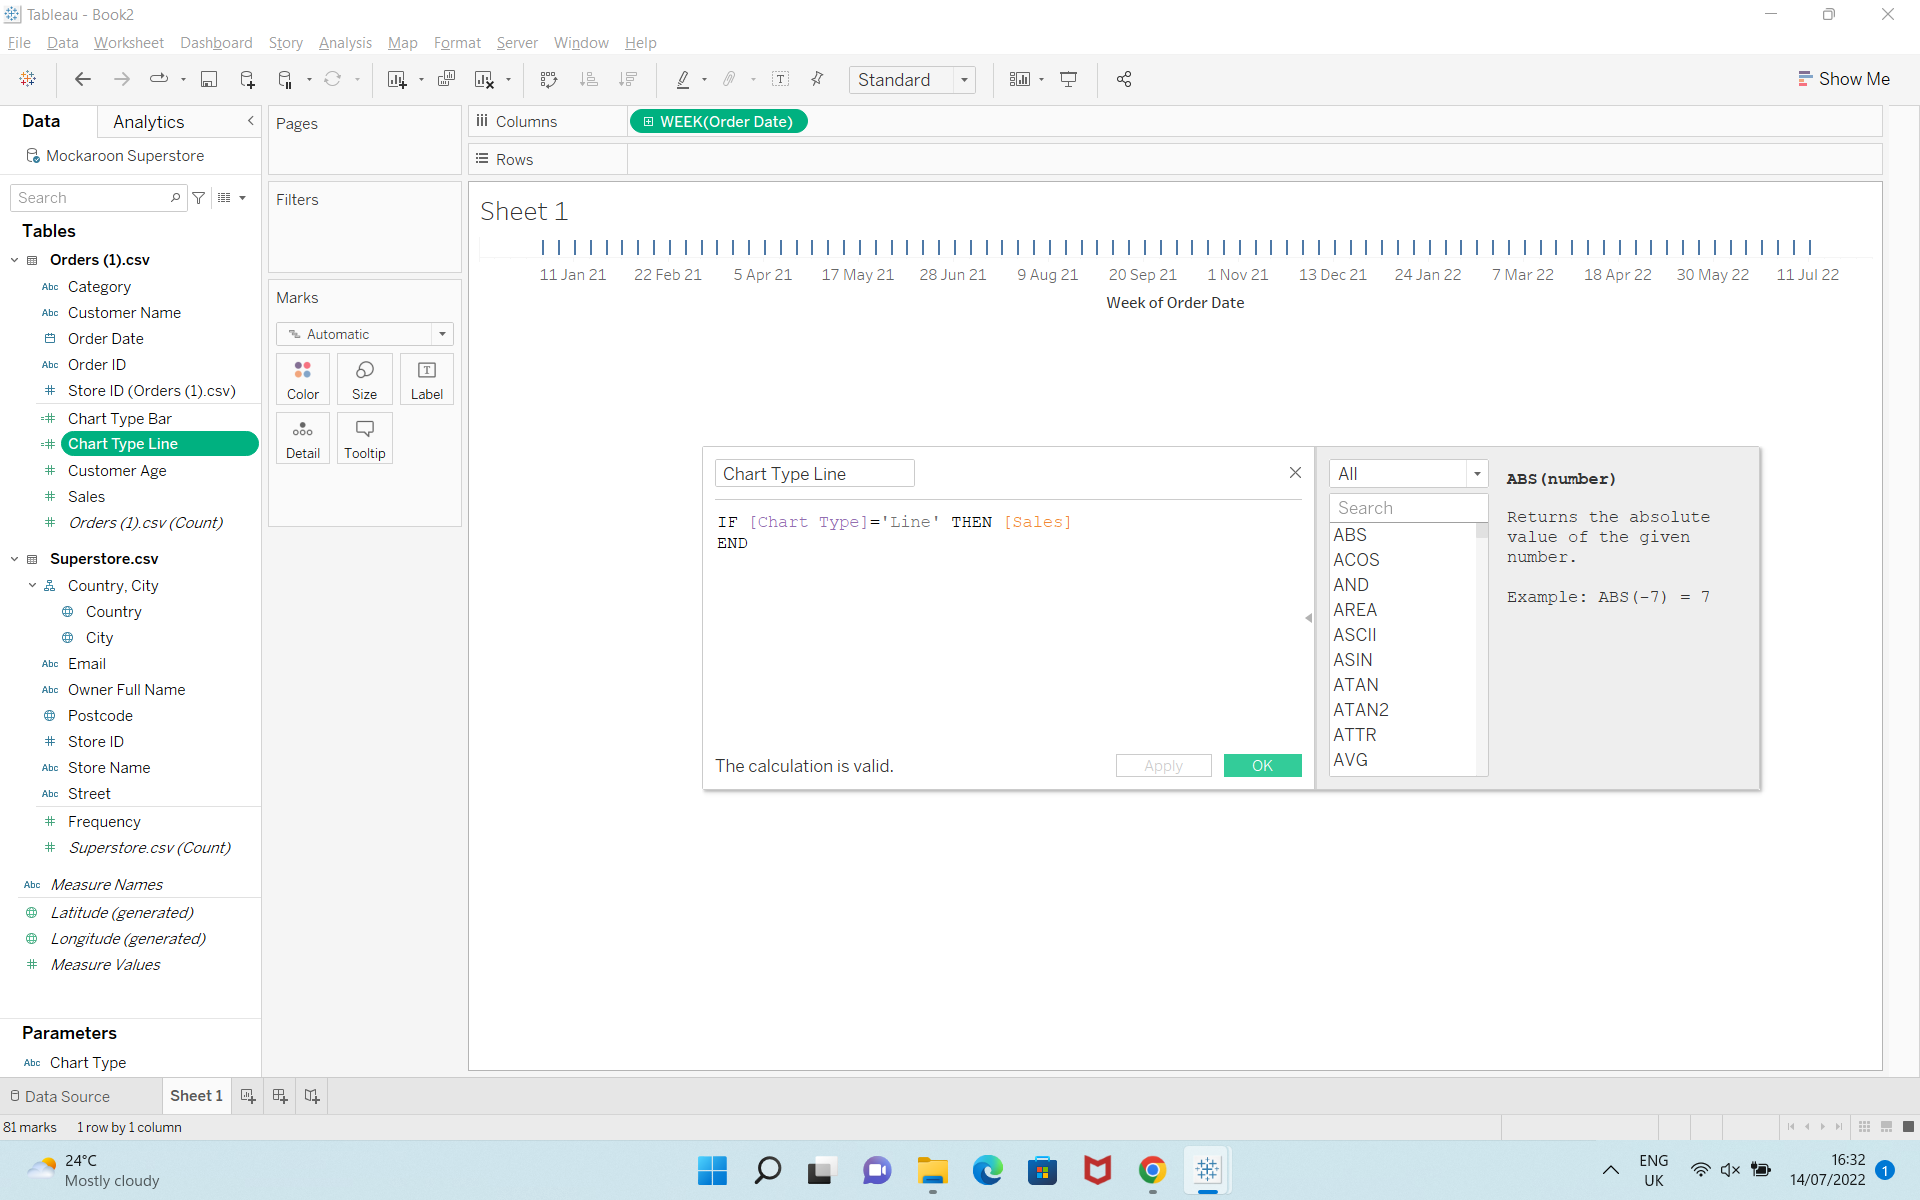
Thirdly, create Calculated Field name it Chart Type Bar and Chart type Line.
Then, drag Chart Type Line and Chart Type Bar into the Rows. After that click Chart Type to show parameter.
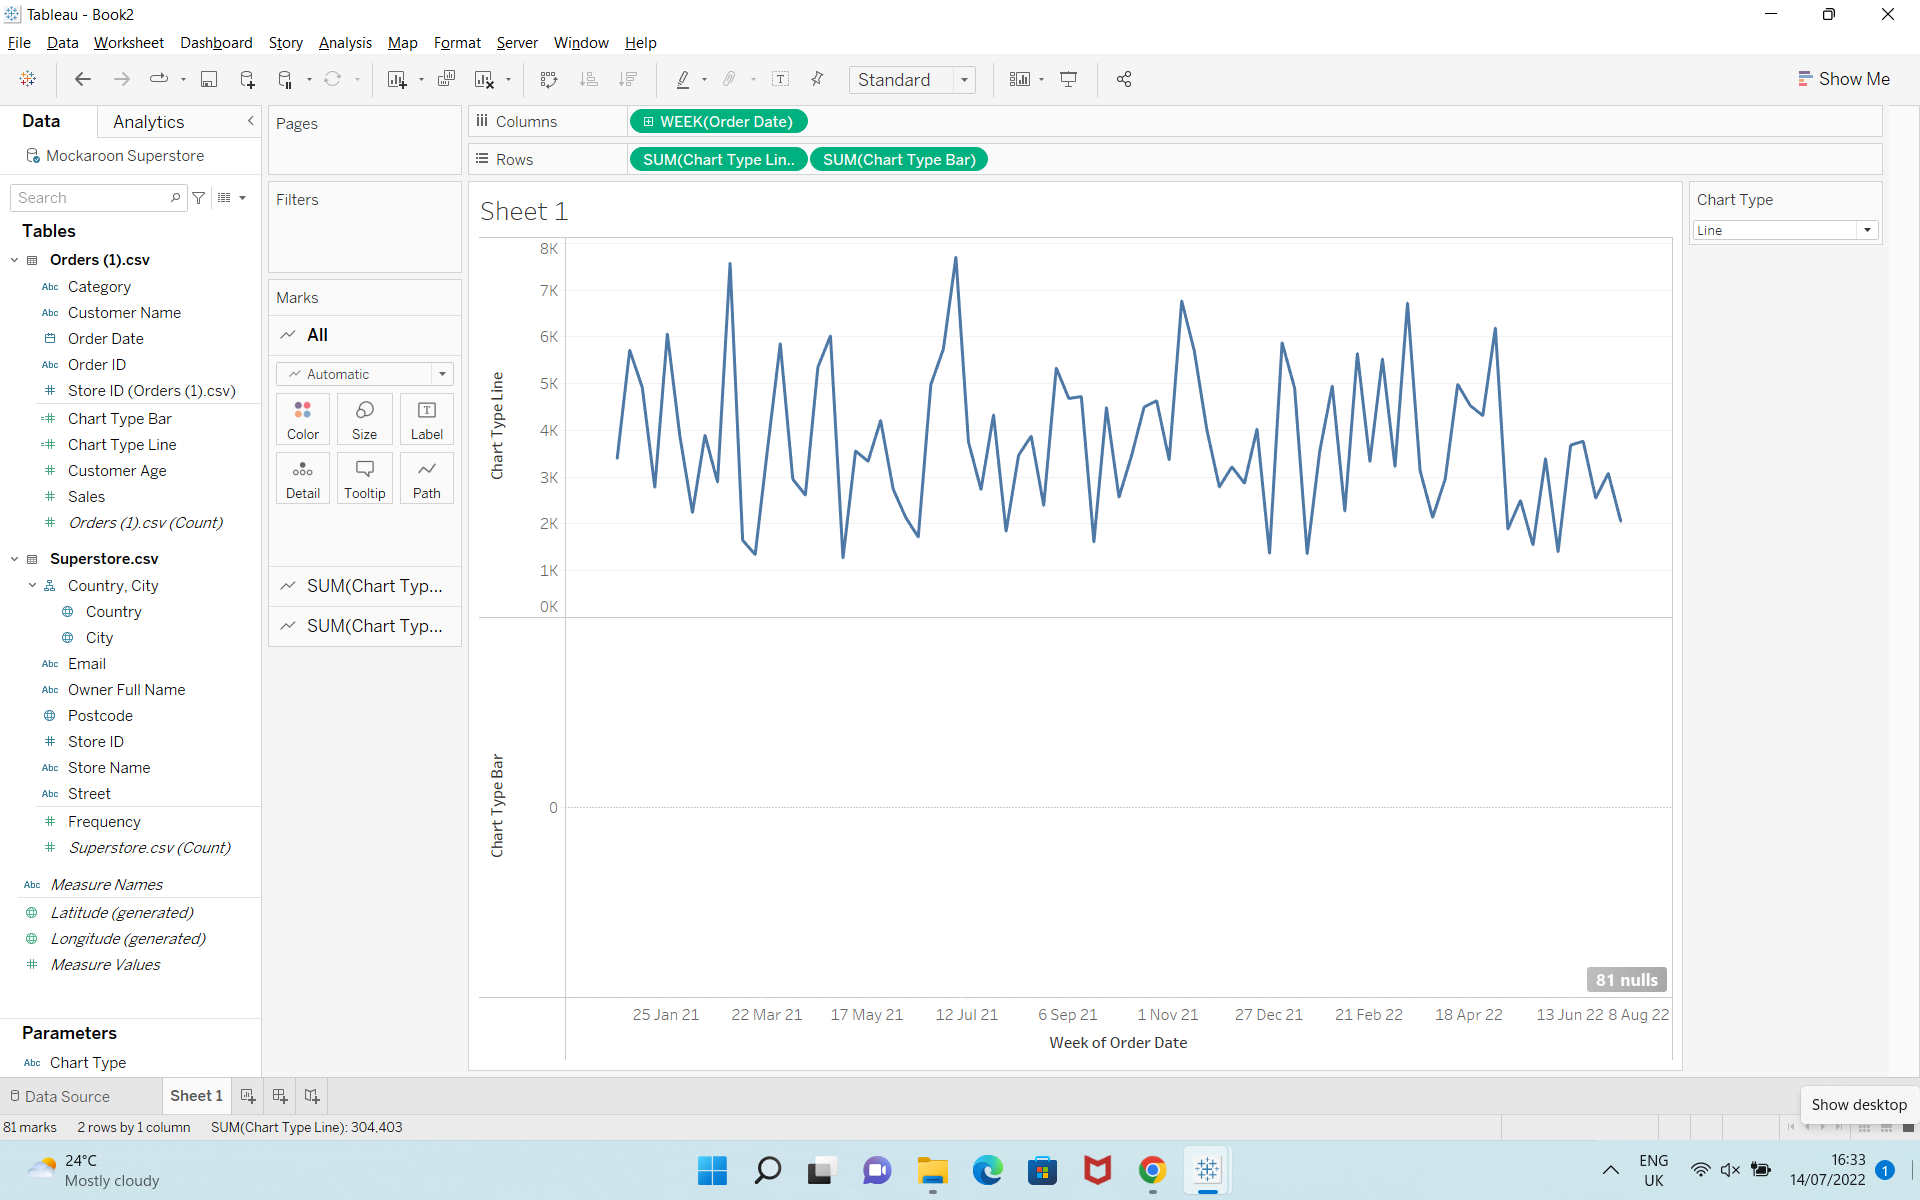
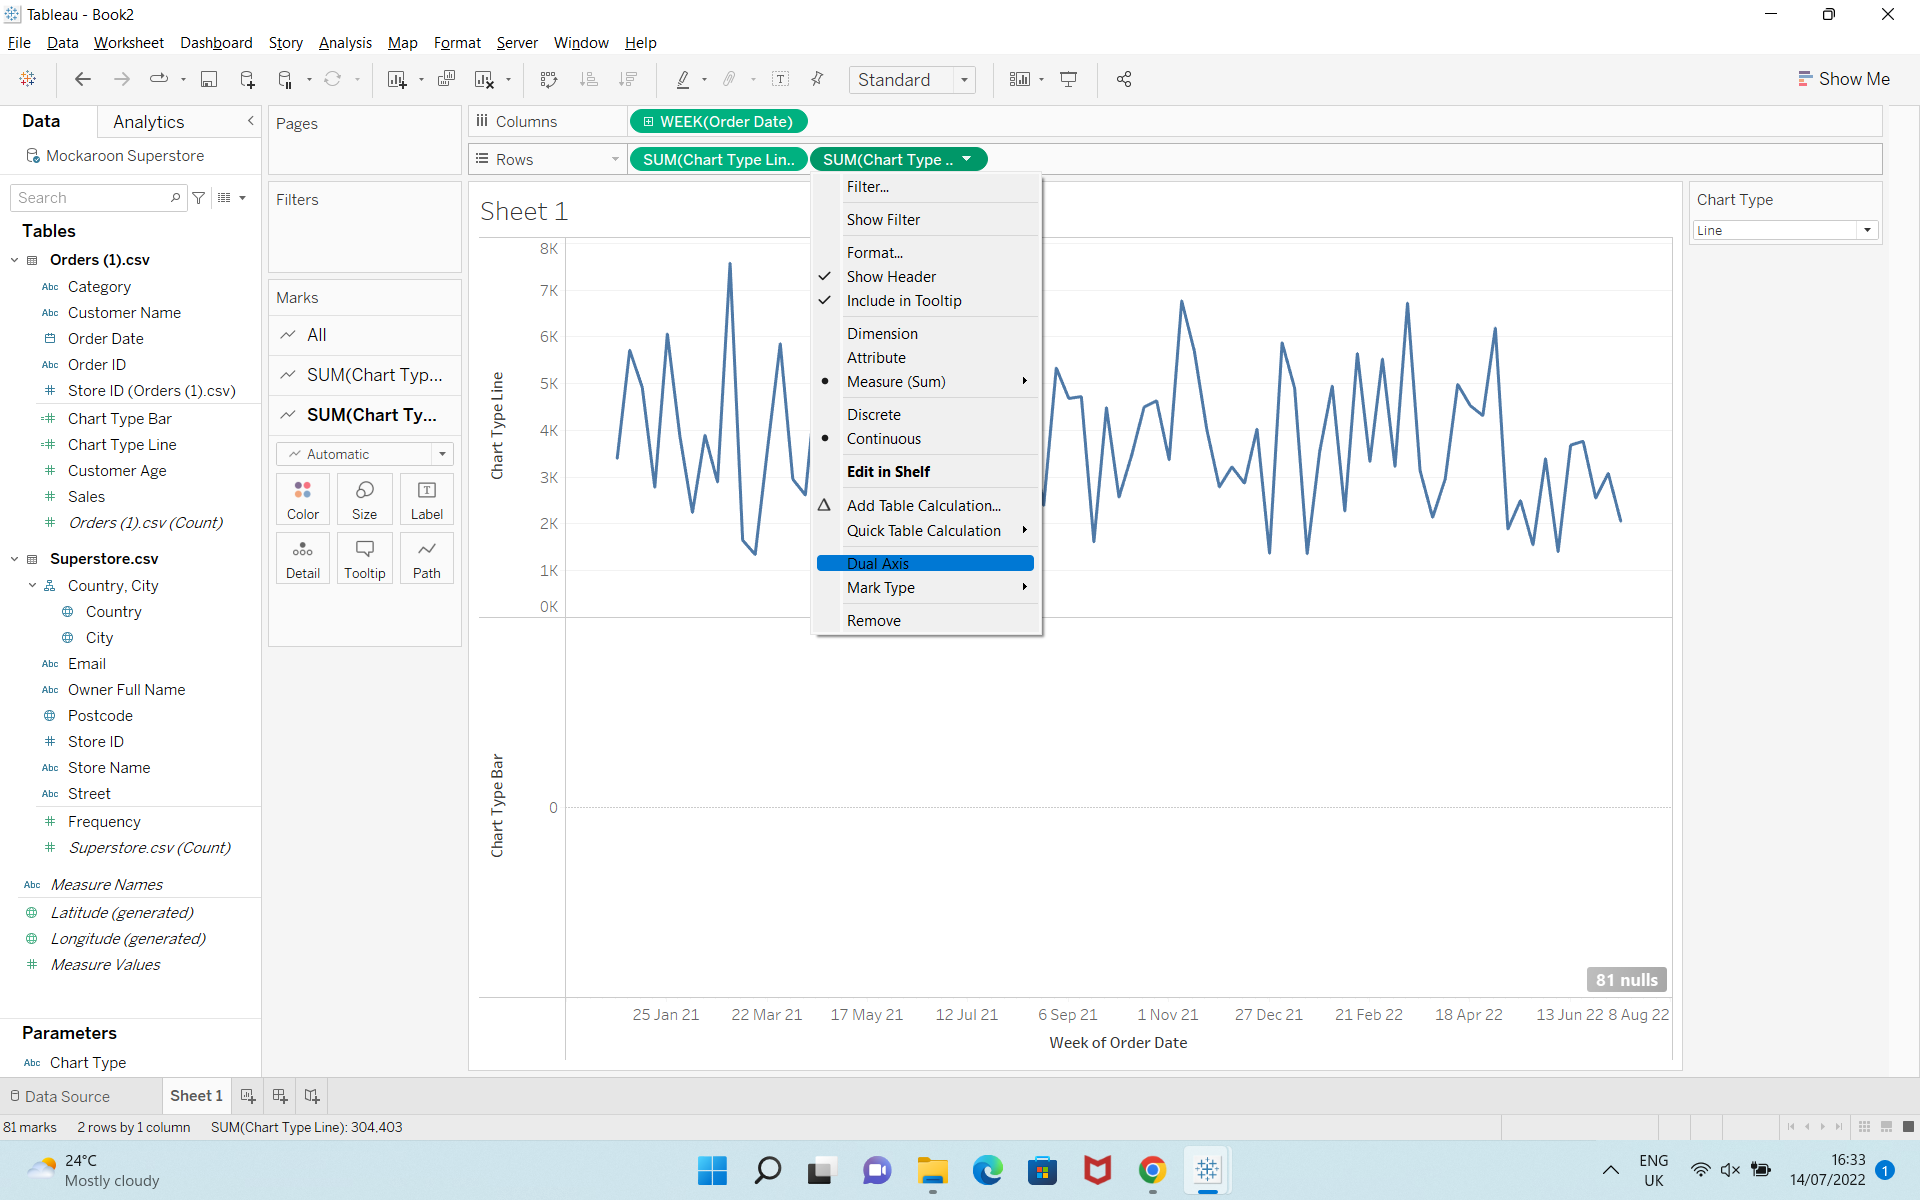
Next, click Chart Type Bar and choose Dual Axis and Synchronize Axis.
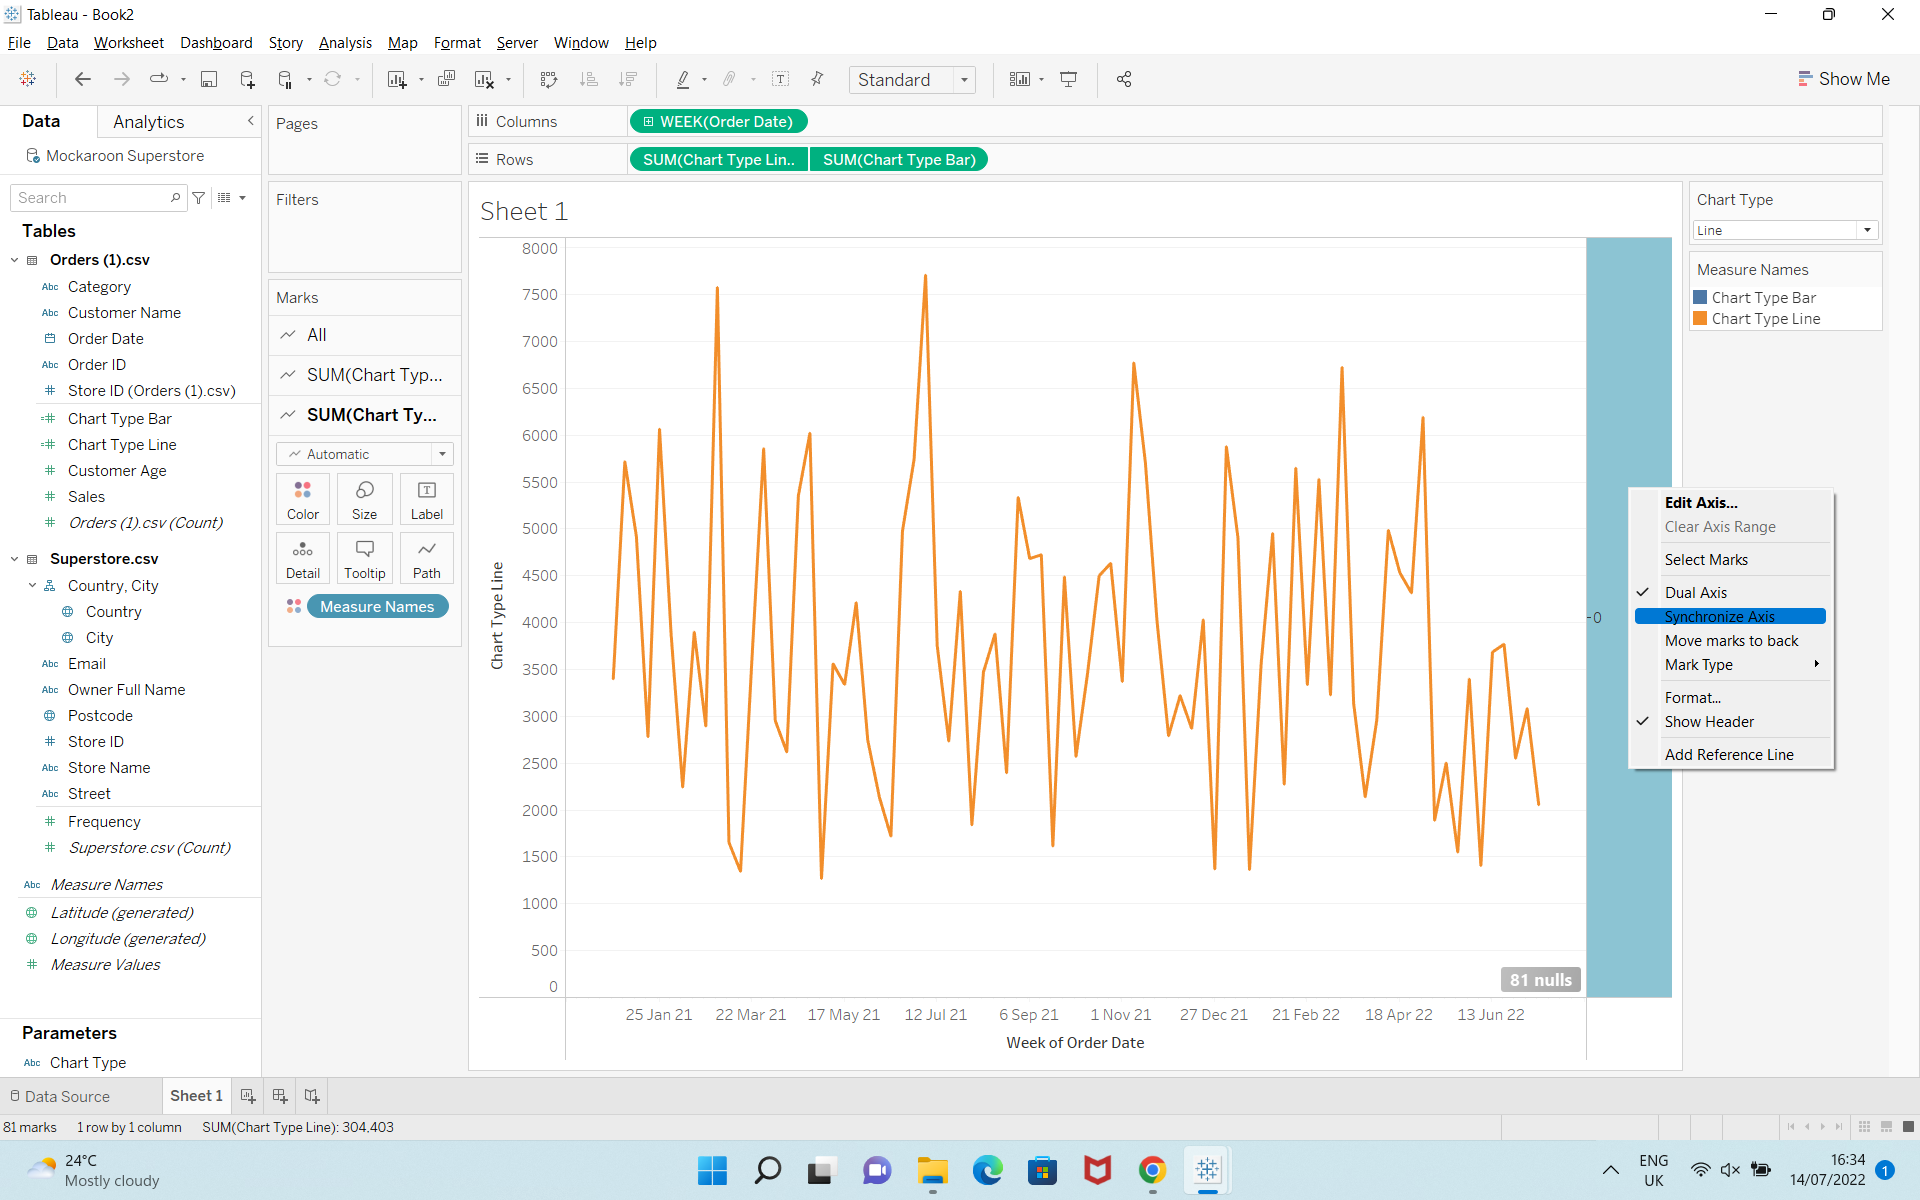
Then, Right click the null value in the worksheet . After that, go to Marks and choose line for the Chart Type Line and bar for second one.
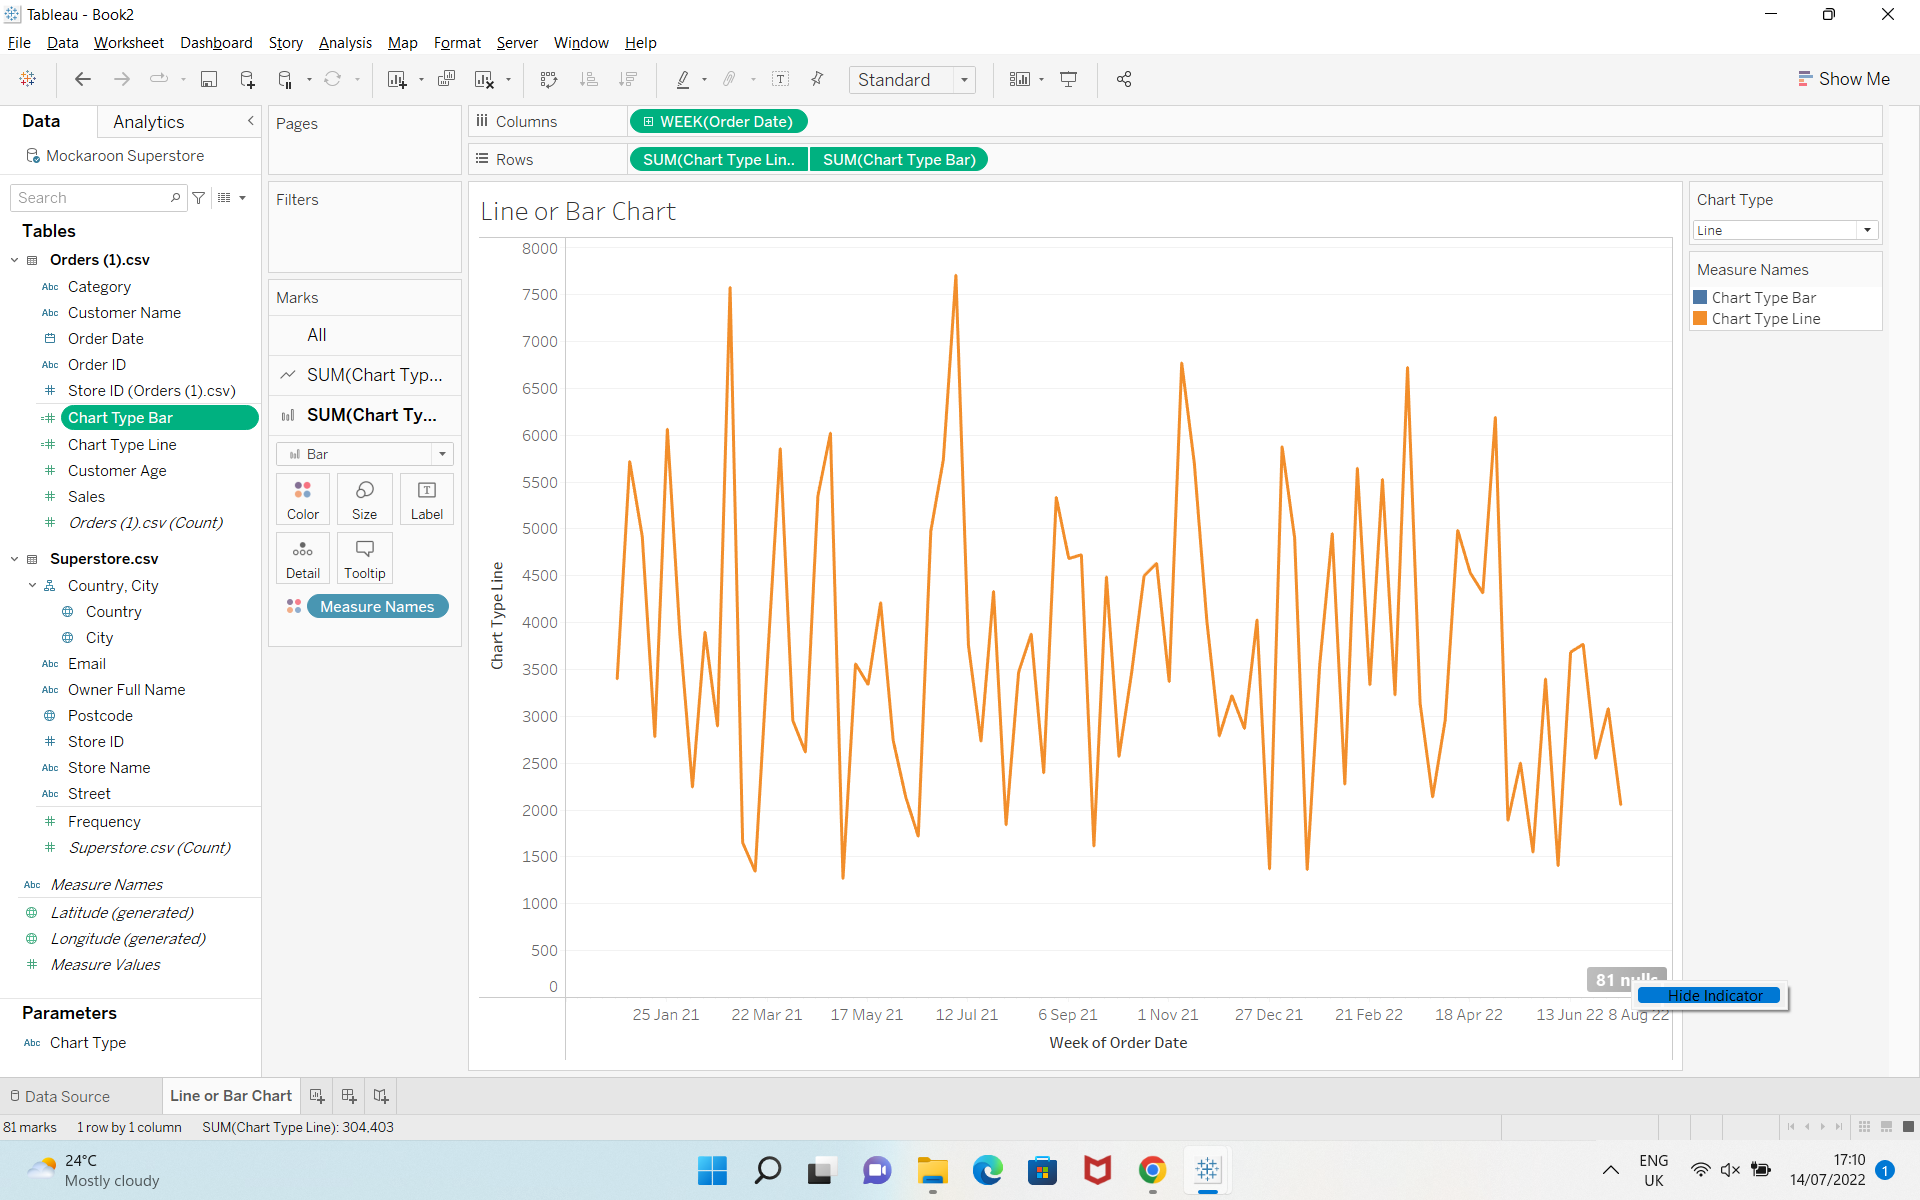
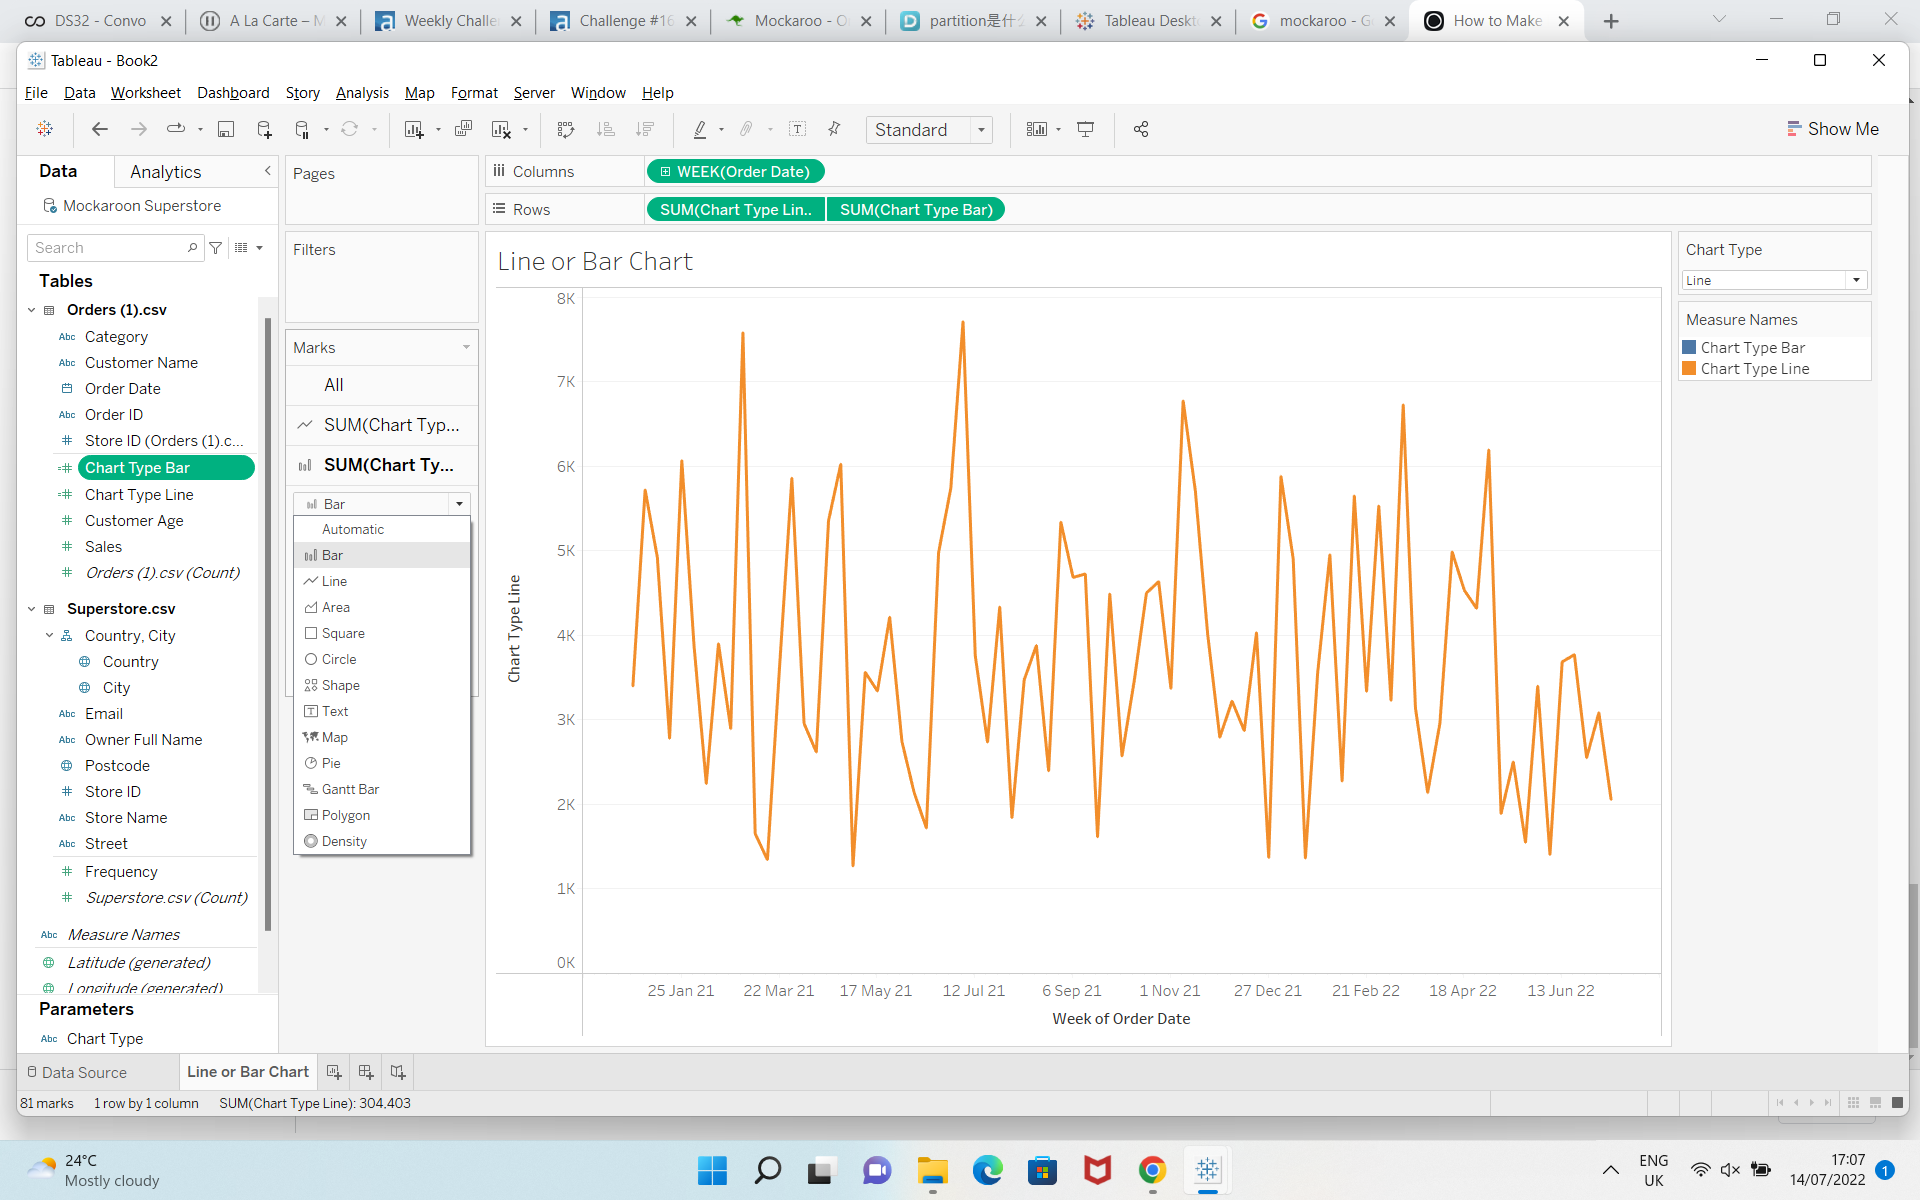
Now I can switch the Chart Type from Line to Bar.
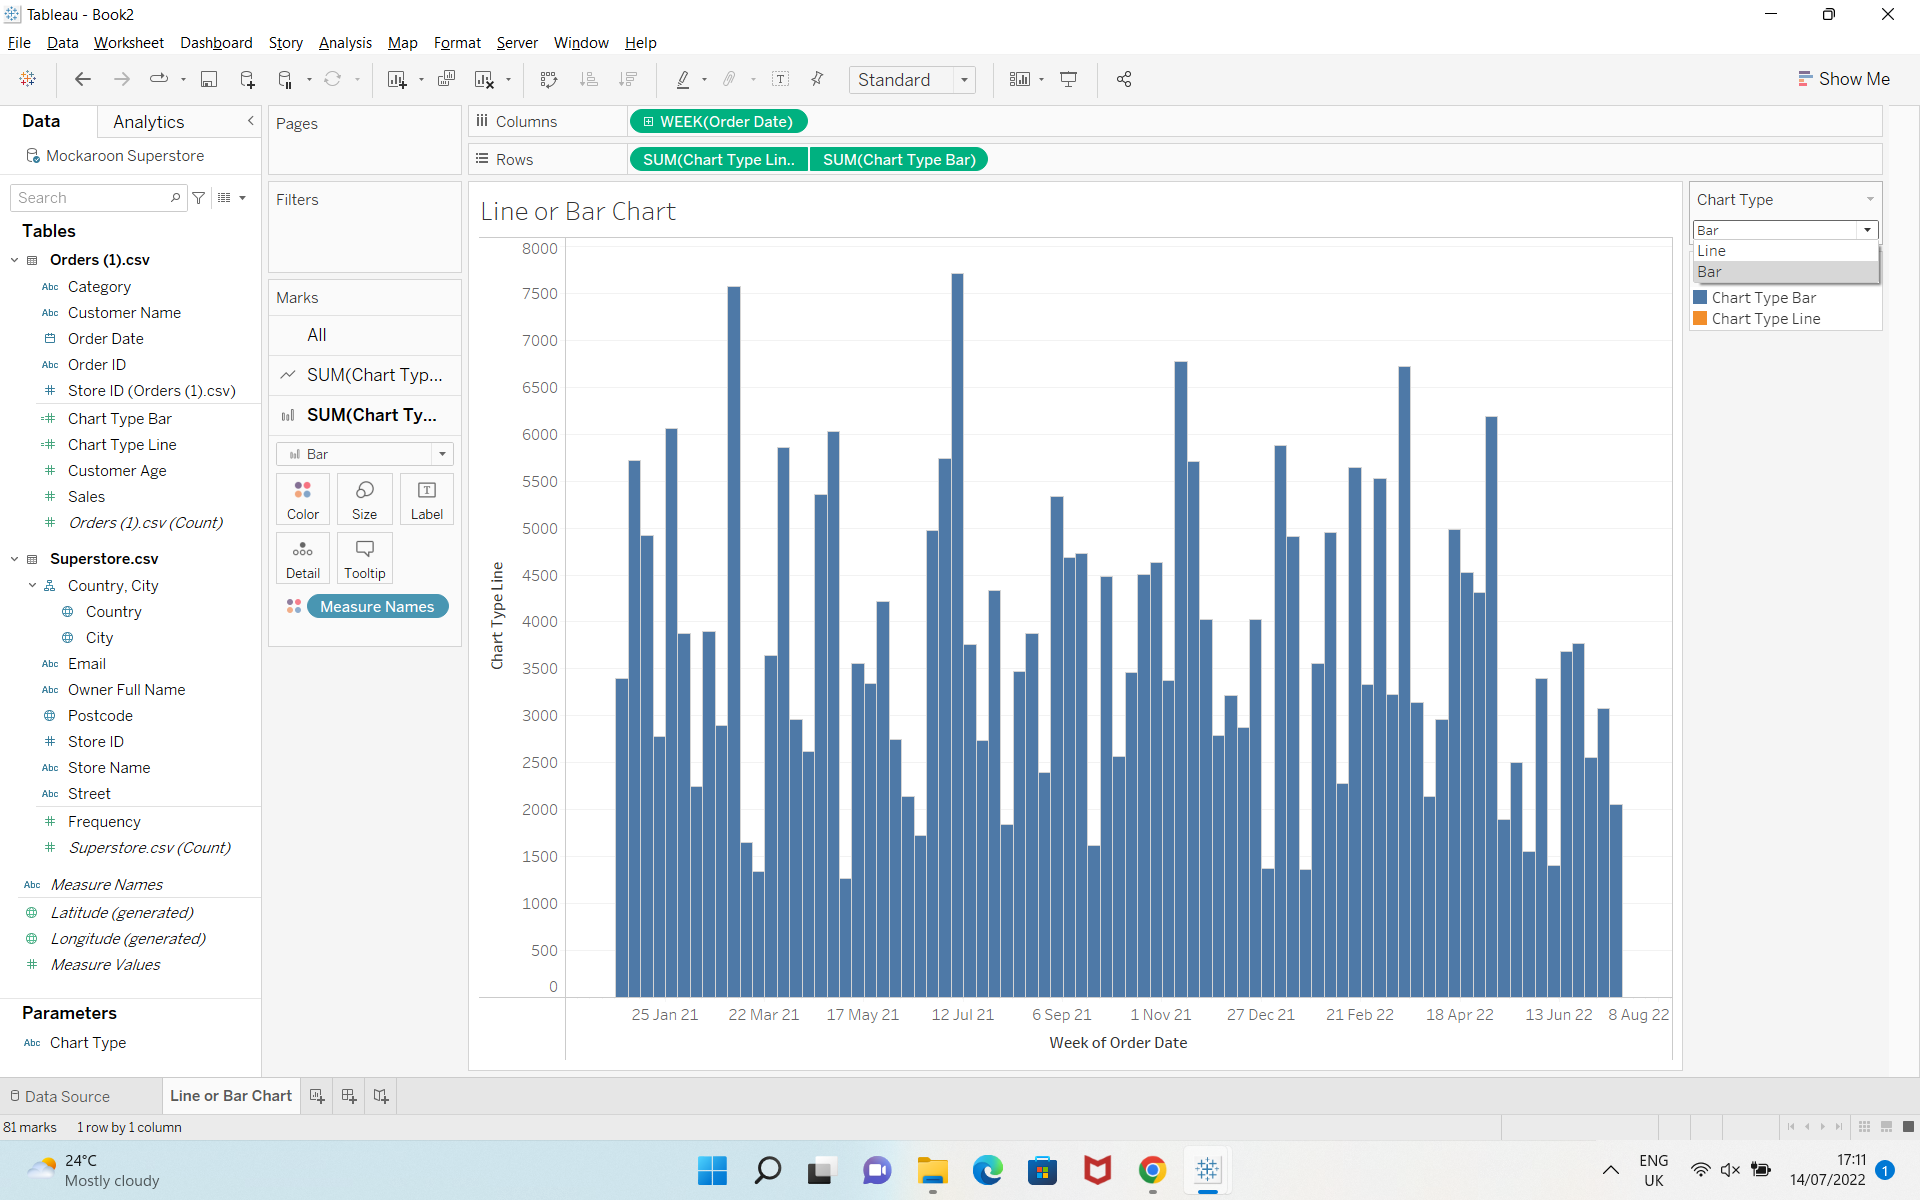
Hopefully, this blog brings you an idea how to make this type of worksheet.
