Over my time at the Data School so far, one of the key lessons I have learnt is that planning and preparation are vital for a successful analysis. These three simple steps will ensure your analysis is clear, concise and well presented.
Step 1: Establish clear questions you want your dashboard to answer about the data. In order to do this ask the data these 6 simple questions: when, where, what, who, how and why. This will help to give your analysis a focal point and make sure the dashboard is easy to understand and there are no unnecessary charts which could cause confusion.
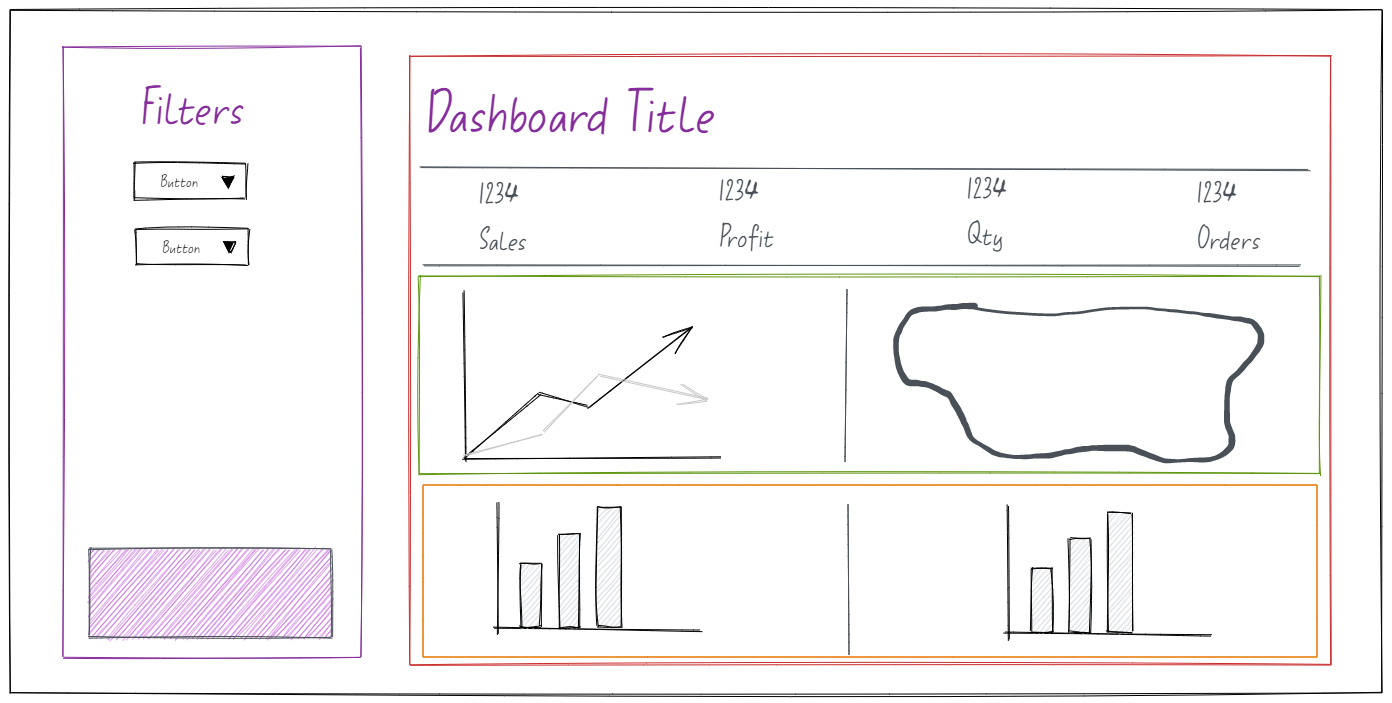
Step 2: Sketch out your dashboard! This is extremely important as it can help you identify which charts will work best and how to effectively lay out your dashboard. Sketching also prevents commitment, if something does not work it can easily be changed.
A very useful website to help sketch out your dashboard is excalidraw as shown below:

Step 3: Building your dashboard! The final step is to build the actual dashboard, having already thought about the key questions you want your analysis to answer and having sketched out your plan, this should be very straightforward.
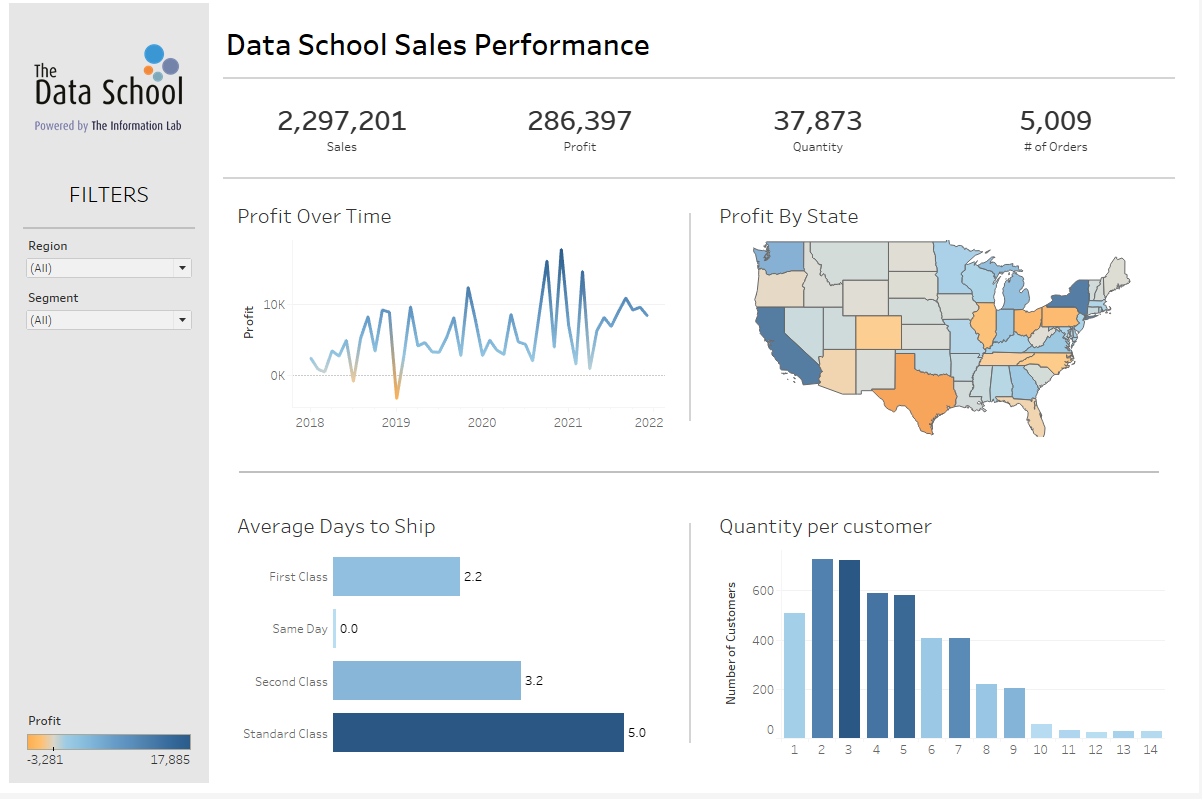
This is my final dashboard, corresponding to the excalidraw plan above:

