


When I got into the Data School and told everyone that I wanted to be a Data Consultant, I often got impressed nods, but puzzled looks.
The terms data and consultancy certainly sound impressive, but what does that actually mean? How would you explain what a data consultant does to a person who doesn't know anything about business intelligence, consulting, analysis, visualizations, or even to someone who doesn't know what “data” means?
My go-to explanation was the following:
I will help companies find a solution for any of their data problems. Which can include helping them organize data, clean data, or create insights, dashboards, and visualizations. It could also involve teaching them about data software and how to treat data (= data literacy).
But again, that is still very complex. So what does a data consultant do in the simplest terms?
To understand that, we have to first look at the “lifecycle” of data in a company (also called the data pipeline). While this is different from company to company, here is a simplified version that uses the purchase of a sandwich as an example (shout-out to our New York Head Coach Michael McFadden for the metaphor):
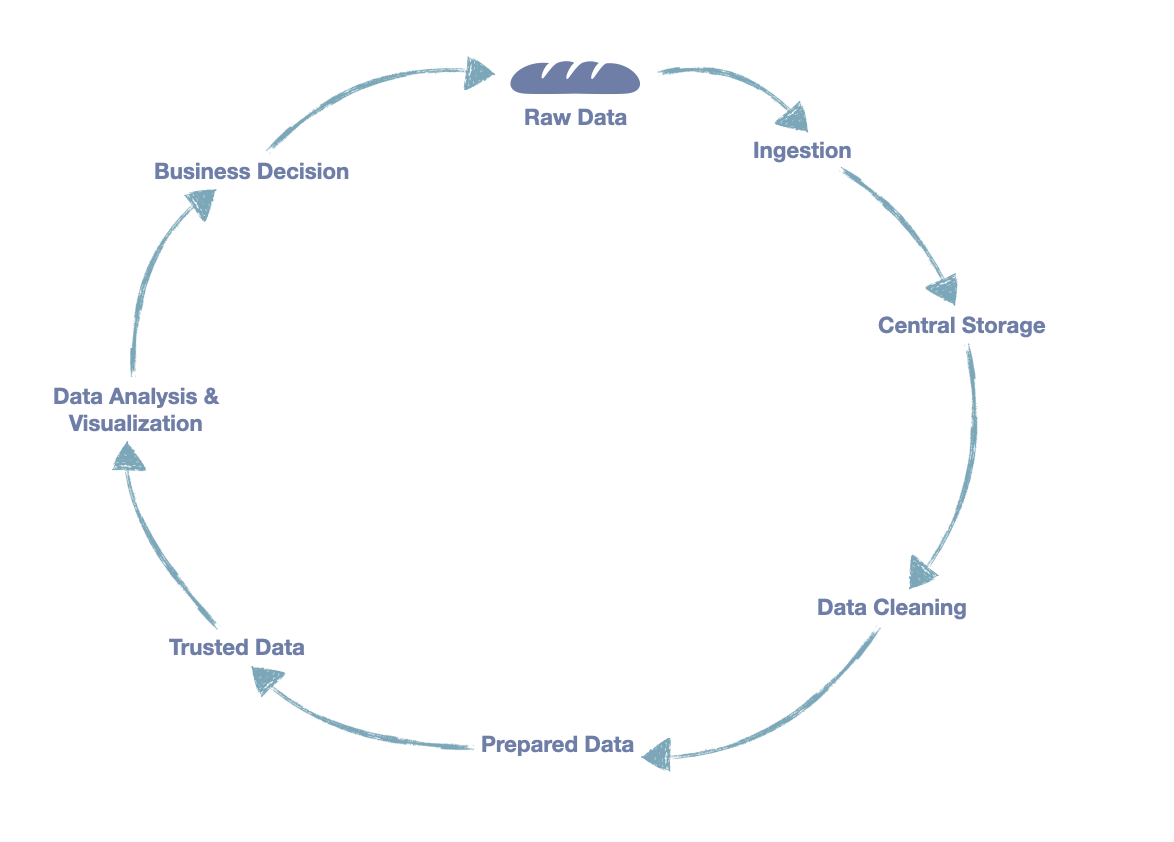
1st step: Raw Data, Ingestion, and Central Storage
Let's assume you go to a store and buy a sandwich. The check-out will automatically store some data about that purchase, e.g. at what time you bought it and what type of product you bought (here: a ham sandwich). We can say that the data was "ingested", since the data is transferred to some sort of storage facility, for example a database or a cloud server. The data is then stored until we will further use it.
2nd step: Data Cleaning
When we have enough data, a data analyst or consultant can "clean" the data. For example, we make sure that the prices and product names are accurate. Maybe the register logged the product name in CAPITAL LETTERS, but it is easier to read in lower case letters. So we can use software (for example Tableau Prep or Alteryx) to clean our data. At this point we could also add additional data, for example in which city the sandwich store was located.
3rd Step: Prepared Data
After cleaning the data, a company may choose to create sub-files out of this big data file, e.g., one file with information about sales, another file with information about the ingredients of each product. These files will be useful later for different departments within the sandwich company.
4th Step: Trusted Data
After creating these subfiles, some companies may opt for a trusted data source (definitely recommended!!!). These are subfiles (that include our cleaned data), but someone double-checked that this data is accurate and matches across files and sources.
5th Step: Data Analysis, Visualizations, and Business Decisions
Now that we have trusted data files, different departments can choose to analyze all or parts of the data and visualize the results and insights for their target audience (for example with Tableau).
For example, the Marketing Department could create an infographic about the healthy aspects of the ham sandwich and how many times it was sold in a certain neighborhood. This infographic may be displayed publicly so that anybody who visits the sandwich store is incentivized to buy that sandwich. Another example would be the Sales Department. The employee (or a consultant) could create a visualization to show how many sandwiches were sold each month and how much profit that product made for the whole company. This result could be shared with the manager who would base business decisions on that information. The manager could increase production of that sandwich or create discounts during months when sandwich sales were low.
So what about the data consultant?
Okay, now that we have seen how the sale of one sandwich can lead to business decisions that then affect that sandwich again (a circular pattern), now we can determine where the data consultant comes in: at any point during that cycle!
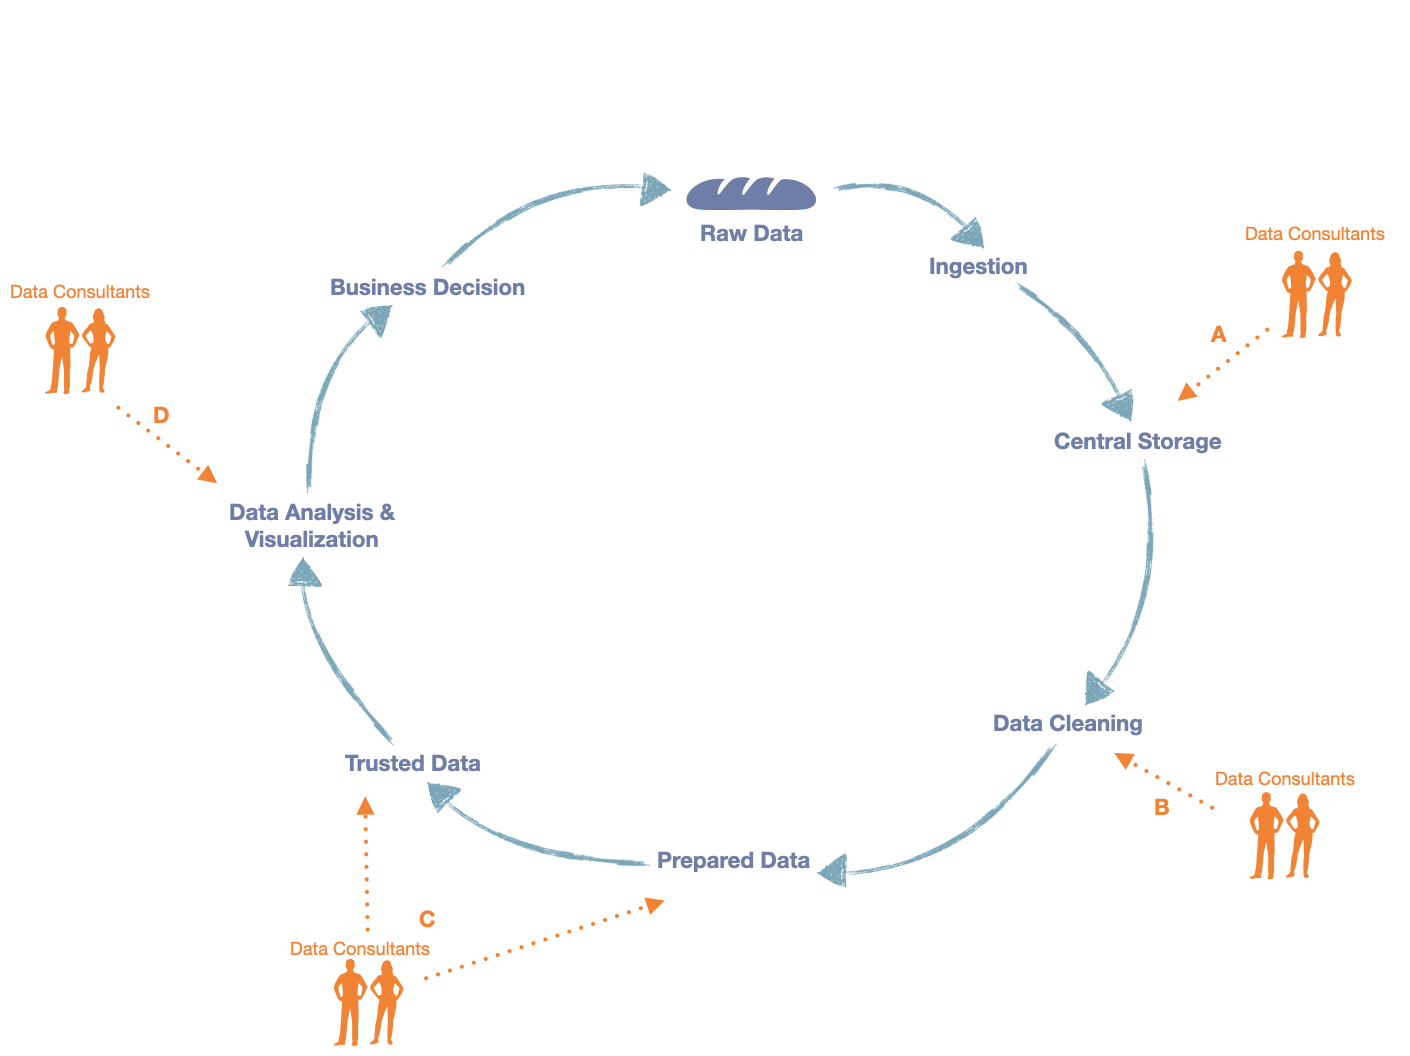
A data consultant may support a company on how to properly store and organize their data (arrow A). A data consultant may advise a company on data cleaning processes, or teach the existing employees how to clean data more efficiently, or the data consultant may even do data cleaning themselves (arrow B). A data consultant may assist in creating subfiles or ensures that no data has been altered and a trusted data source has been established (arrow C). And lastly, a data consultant may assist, teach, conduct analyses, and create visualizations within different departments of the company (arrow D).
One last note: this is a simplified data lifecycle diagram or data pipeline. Some companies may have more steps in between, some companies have less. But the bottom line is the same: the data consultant helps at whichever point in the cycle the company needs it the most.
Photo by Carlos Muza on Unsplash
Graphs created by Lisa Hitch