


Researchers, data analysts, and data consultants will -at some point- have to combine multiple datasets to create a larger or more complete one. There are different ways on how to combine them.
Joins
When joining datasets we want to expand our original datasets by more variables (or columns) than what we had before. In most cases we combine datasets that have at least one variable in common, for example for example ID or store name. When adding more variables (columns) to our dataset, we expand horizontally.
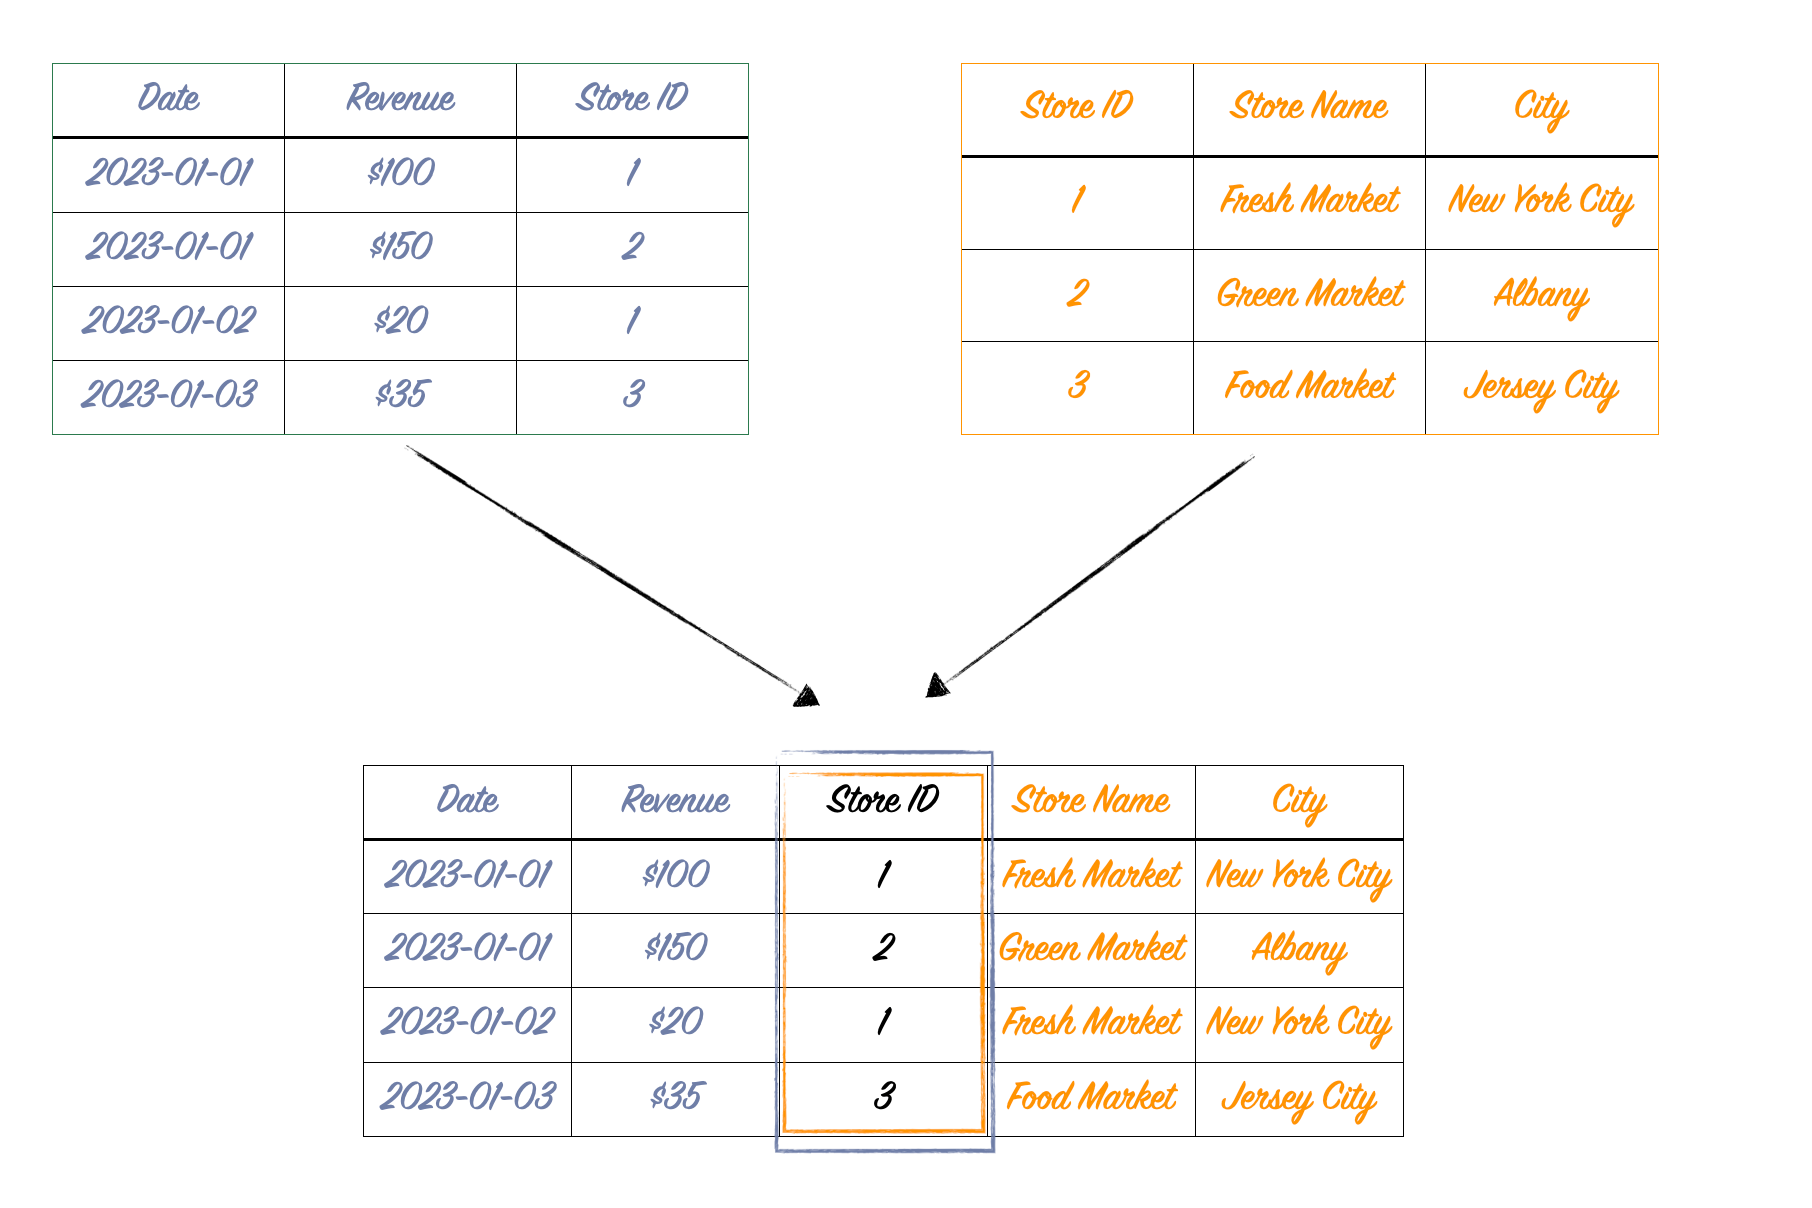
The example below illustrates a join or horizontal expansion. The blue dataset on the left has information on sales from different stores. But the stores are just listed as 1,2, and 3. The second dataset (orange) on the right provides more information about the individual stores. We can join both datasets to have the information readily available in one sheet, because we have one common variable: Store ID.
But be careful! The rule "Joins expand data horizontally" is true, but in some circumstances your data can also expand vertically!
What I demonstrated above is a so-called inner join. This means that we only take the data that overlaps between the two dataset and that have the identifier (here: Store ID) in common.
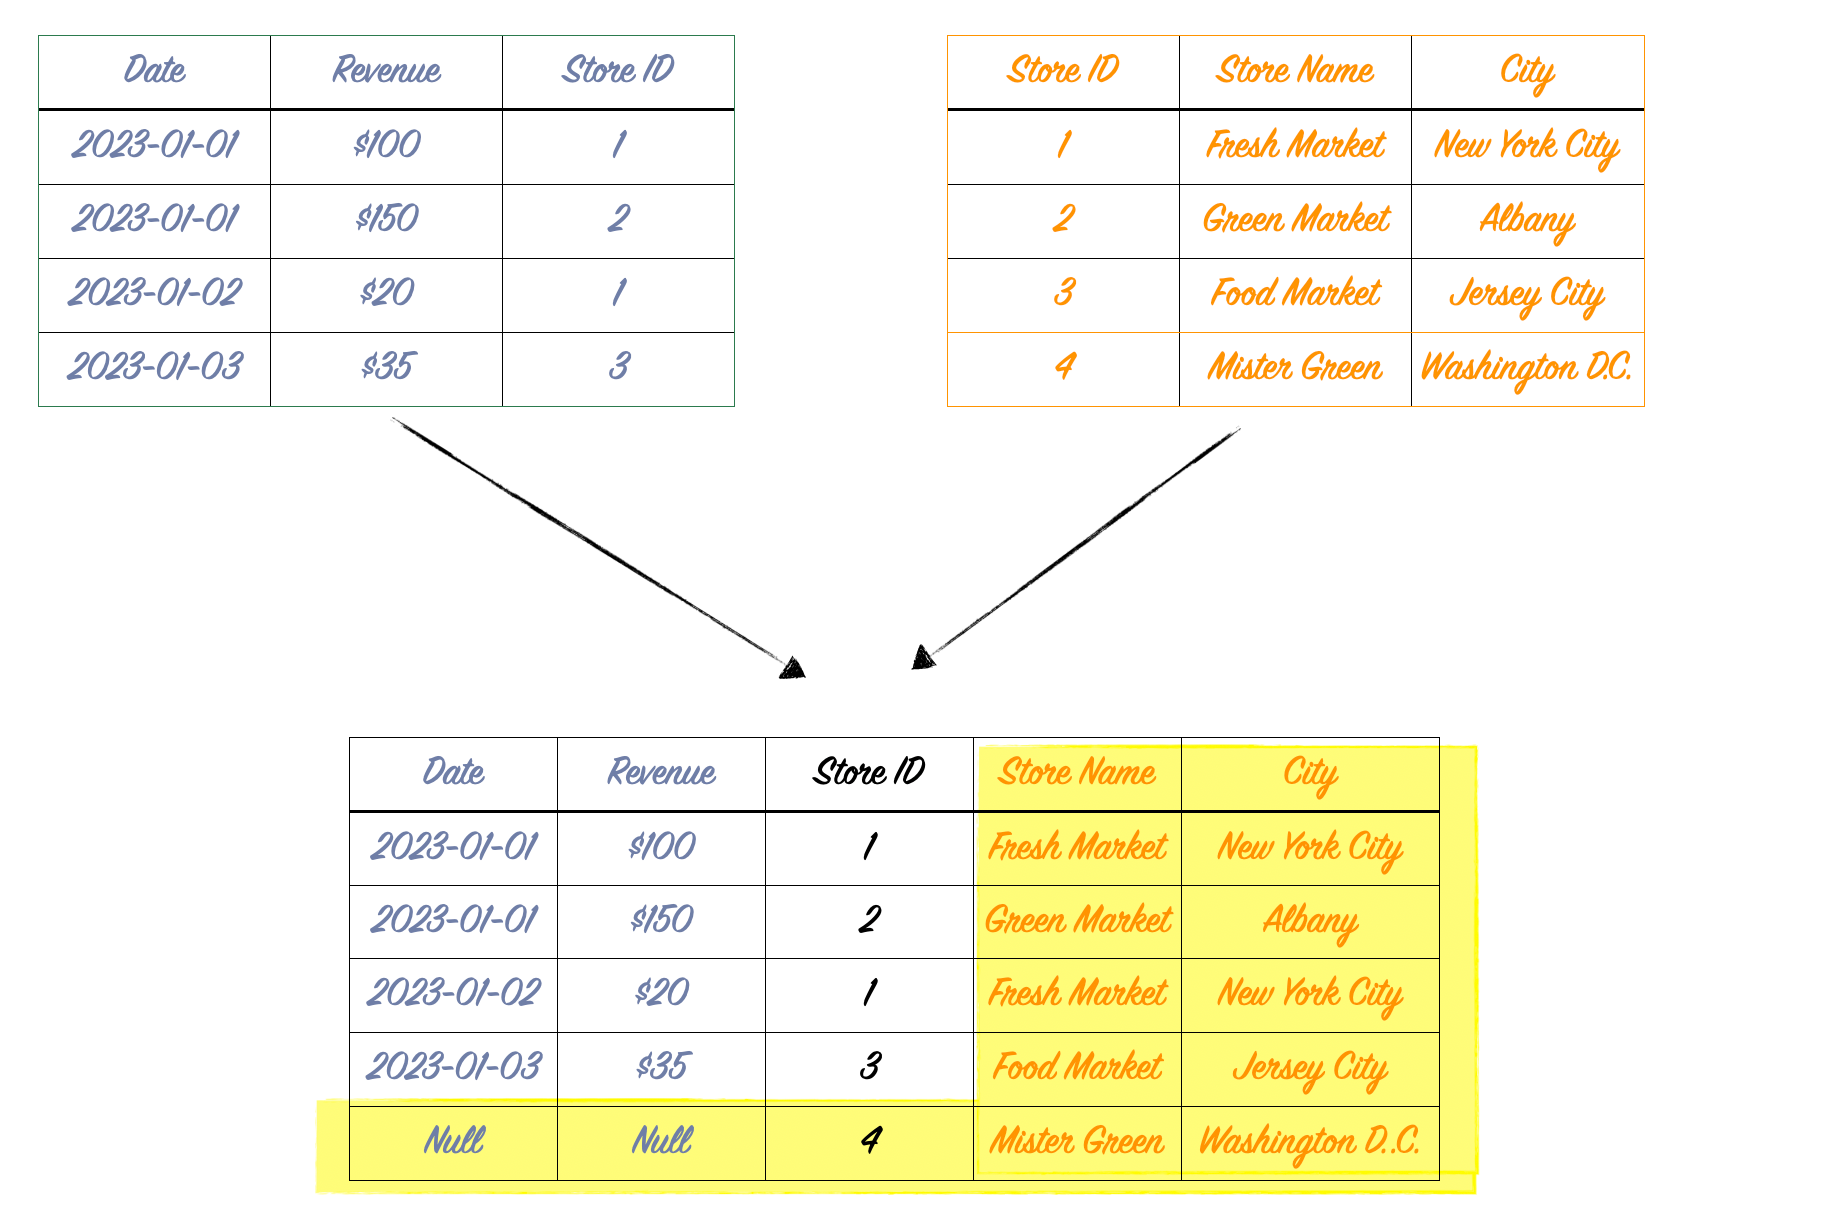
There is another type of join called right join. This type of joining lets you keep rows from the right dataset even if the left dataset does NOT have that store ID. For example, our right dataset might have a store ID with the number 4, but our sales data set on the left does not indicate any sales made at that store.
With a right join, the table would expand vertically by one line as the store with the number 4 would be added with Null values. The yellow color in the picture below demonstrates which columns and rows were added compared to our original dataset. You can see that with this type of join we added both columns (as expected), but also added one additional row!
Unions
In other cases we have the same structure of data but in different datasets or sheets. For example, we have the sales data for the stores separated by month and we want to combine all month together into one large dataset for the whole year. In this case, we would use a Union.

But be careful! The rule "Unions expand data vertically" is true, but in some cases your data can also expand horizontally.
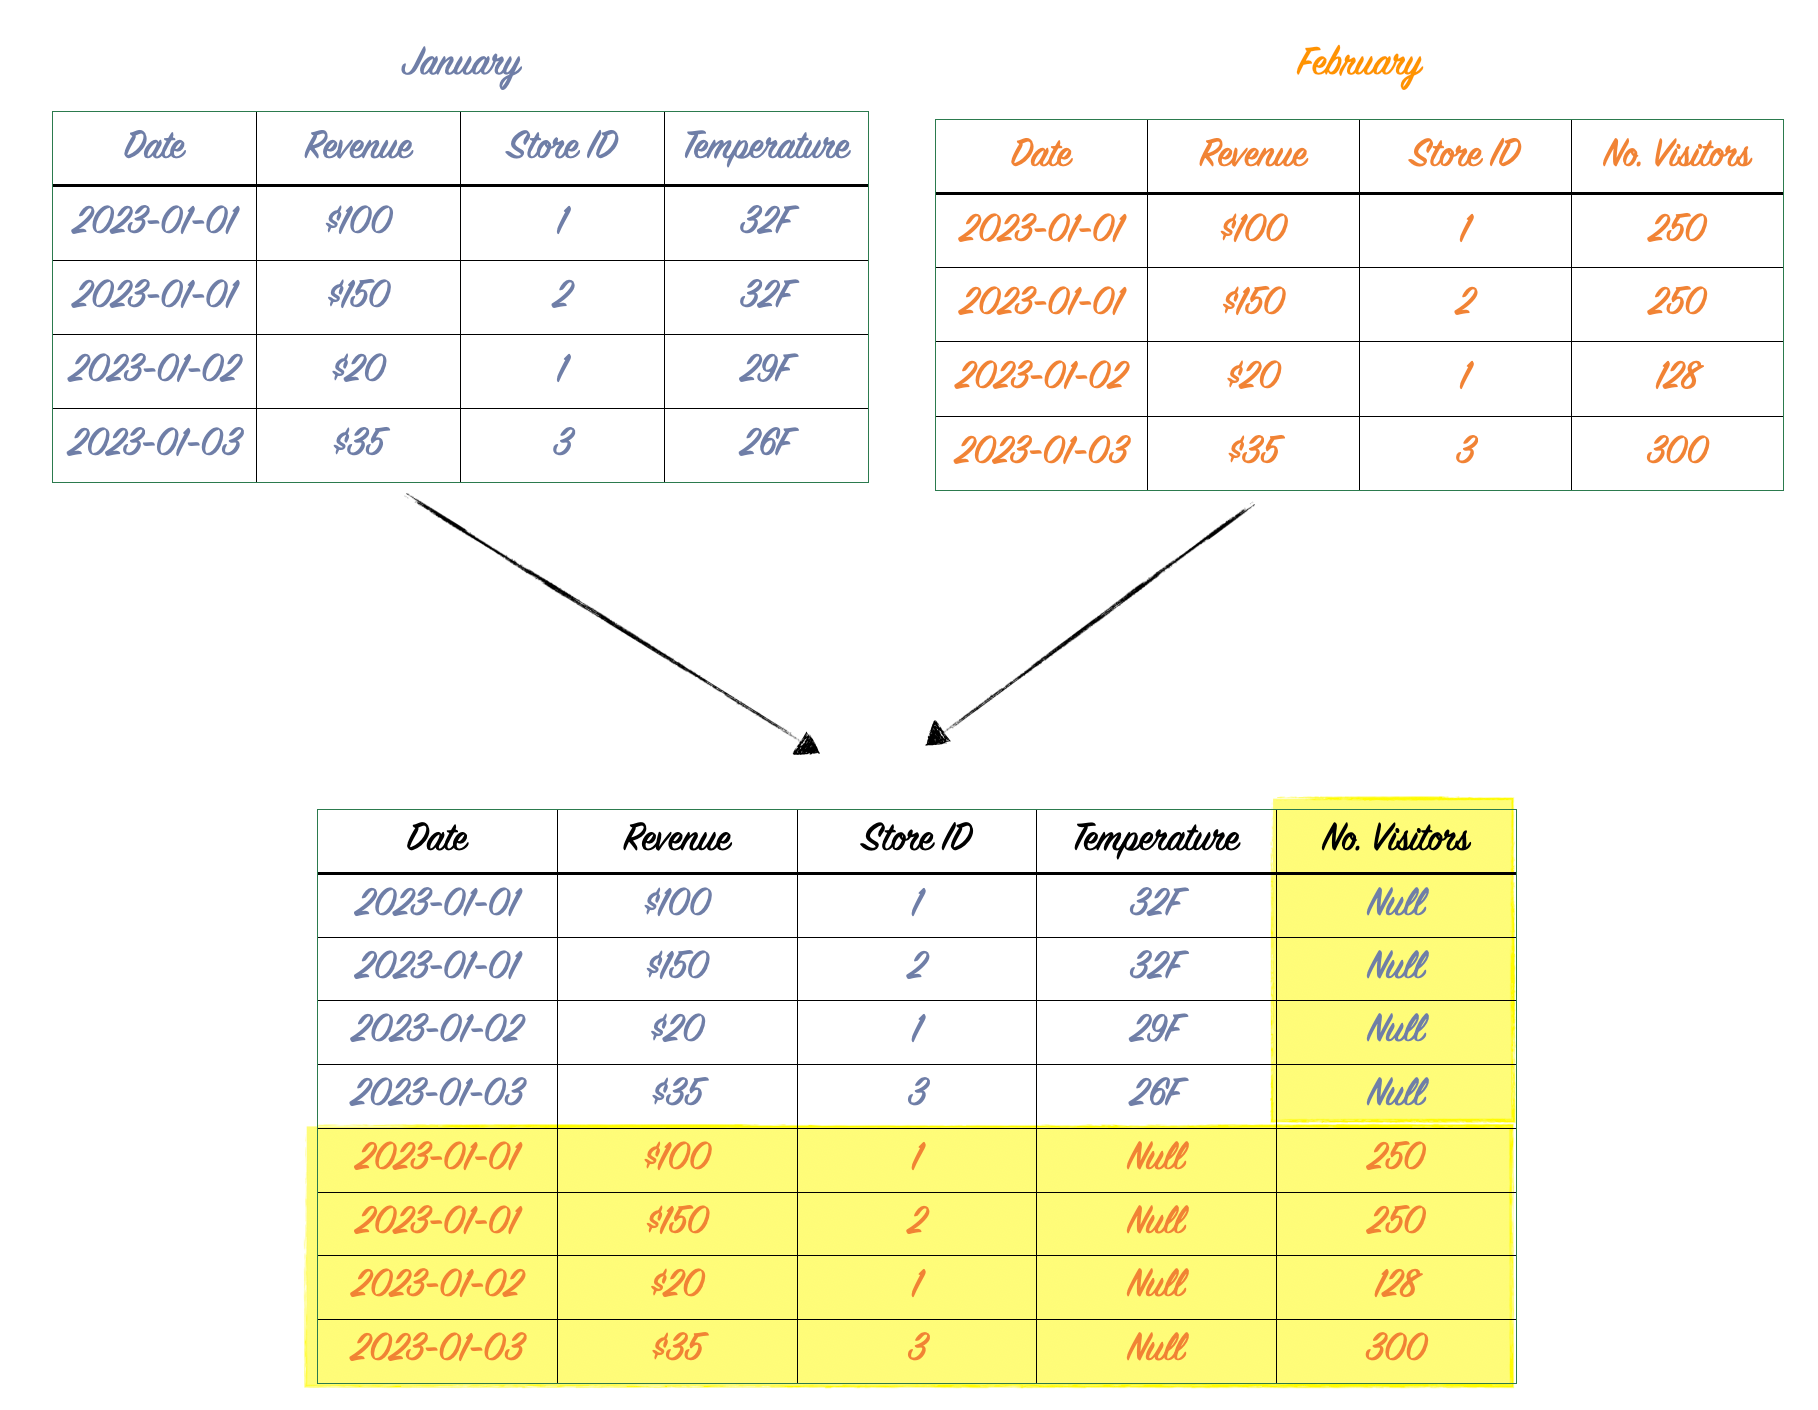
Let's say our data across the different months is not exactly the same. The January dataset includes the average temperature at that particular day. The February dataset includes data about the total number of people who visited that store on that particular day. When we choose a union to combine the datasets, we will also add those columns even if they don't match across datasets. The dataset that did not have those values (e.g. the dataset without information about temperature) will receive Null values.
The below image illustrates that. Note that the yellow indicates the new columns/rows we added as compared to our original dataset (left side). You can see that we both expanded vertically (as expected), but also added another column with the Number of Visitors horizontally.
Conclusion
Yes, the rule "joins expand data horizontally, unions expand data vertically" is correct in most cases and a good rule-of-thumb to remember the difference between Joins and Unions. However, in some cases you dataset will still expand horizontally in a Union and vertically in a Join. Watch out for these cases and make sure that this is what you intend to do!
Illustrations created by Lisa Hitch