


Disclaimer: This article is about my timeline from when I first learned about the Data School to submitting my initial application dashboard. This timeline worked for me, but it may not work for you.
When I learned about the Data School at the end of April 2023, I had never worked with Tableau before. I first debated whether I should give myself a year to learn the software before applying, but the application deadline for the next cohort (DSNY5) was coming up in only less than 6 weeks and I had a distinct feeling that I would regret not even trying (and it indeed paid off).
So, just like the planner I am, I sat down and mapped out how many days I have to learn Tableau basics, learn as much as I can about the Data School, and build an application dashboard: 40 days! I then mapped out which weeks I would dedicate to learning Tableau fundamentals and which weeks I would focus on my initial application dashboard. I planned backwards, e.g. I wanted to have time to receive feedback and be able to make multiple iterations on my dashboard. In the end, I dedicated the first 3 weeks to learning Tableau and the last 3 weeks to creating and iterating on my dashboard.
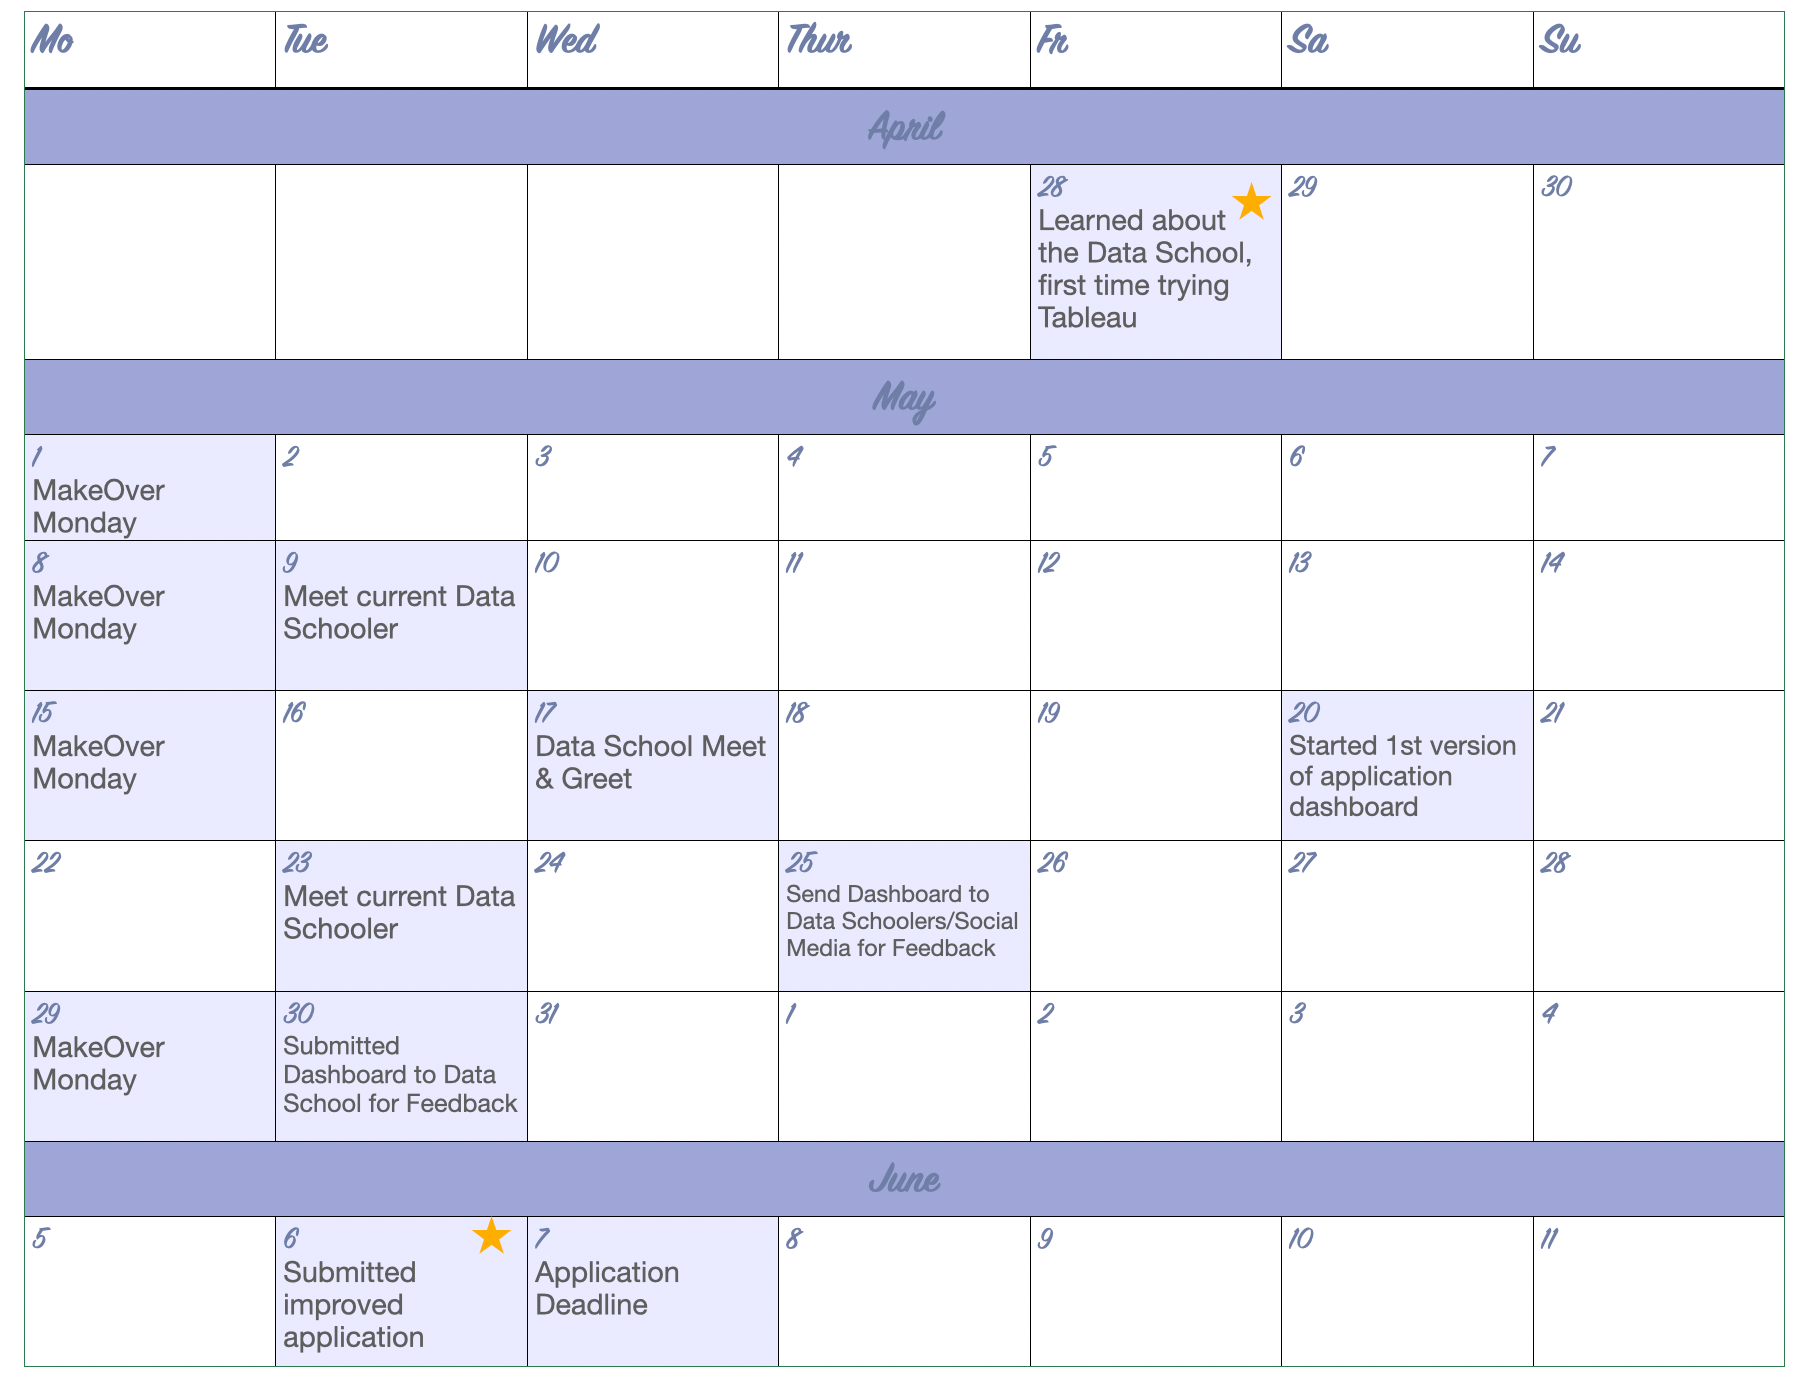
The following picture shows my timeline. Important note: This was MY timeline. I was fortunate enough to work on a very flexible schedule at the time and could dedicate 2-3 hours each day to learning Tableau and working on my dashboard. Your timeline may look different and that's okay!
1. Learning the Fundamentals
The first 3 weeks, I focused on Tableau fundamentals exclusively. I participated in Makeover Mondays every single week and watched Andy Kriebel's Watch Me Viz where he creates charts for the respective week's dataset. I paused a lot and tried to follow along - it was an amazing learning experience even if I didn't always know what I was doing. It also motivated me immensely because I was able to build charts very quickly.
From Day 1, I posted all my progress to Tableau Public and LinkedIn. Were my first vizzes great? No! But I was proud of the progress I made and I wanted to see the progress I will make over time. I also always asked for feedback! Plus: It is a good way for the recruitment team to see your improvements over time and that you are a self-driven learner.
Resources that I used to learn Tableau basics:
- Tableau's Free Training Videos
- Tableau's eLearning platform (This is free if you have a student account through Tableau)
- Datacamp's Tableau Fundamentals Skill Track (I had a free subscription through my university at the time.)
- Andy Kriebel's and Eva Murray's Makeover Monday Book to learn Data Viz Do's and Dont's
- Lots and lots of Youtube Videos, e.g. Tableau Tim and Andy Kriebel's Tableau Tips
2. Learning about the Data School
During the same 3 weeks, I also tried to learn everything I can about the Data School. Here is what I did:
- I reached out to current Data Schoolers to hear about their experiences. LinkedIn was a great place to connect. Don't be afraid to reach out and simply ask about their experiences. All of us are more than happy to share how we feel about the Data School.
- I listened to Andy Kriebel's Dual Axis Podcast (particularly this episode on how to ace a consulting interview was very helpful)
- I attended a Meet & Greet in-person and talked to the recruitment team, 2 current coaches, and many current Data Schoolers. It was perfect for getting a sense of the work culture.
- I watched Youtube Videos on the DSNY Team.
- I looked through the Information Lab's and Data School's websites to learn about the company's history.
- I read many articles on the Data School Blog to learn more about Data Schoolers experience.
3. Building an Application Dashboard
After a few weeks of learning some basics, I felt excited to build my application dashboard. I had long thought about which dataset to use and I ultimately decided to use a dataset that I was familiar with from my previous research work. It was about whether NYC park visitors wore a mask during the summer of 2020. I was familiar with the variables, but kept an open mind to new insights I would find.
I will write a separate blog on the application process, how I built my 2 dashboards, and how I prepared for the 2 interviews. But just in short: I started with building lots of different graphs and then settled on a story that would tie a few of those graphs together.
At this stage, I also mostly focused on receiving as much feedback as possible. I asked for feedback from:
- family and friends
- 2 current Data Schoolers
- The social media community (with the hashtag #datafam)
- I also submitted 8 days before the final deadline to receive feedback from the recruitment team.
Looking back, I would definitely approach it the same way. Now that I am attending the Data School, I also realize how important the more "intangible" learnings along the way were: podcasts about data consultancy and what a data consultant does, sharing my progress on Tableau Public, connecting with current Data Schoolers, and reading up on the company. These may seem insignificant, but they will improve your application a lot!
And always feel free to reach out to me or any other Data Schooler if you have questions or want to hear more about someone's experiences. We are a very friendly bunch here!
Feature image by 2H Media / Unsplash
Calendar picture illustrated by Lisa Hitch