


Alteryx has a lot of different spatial features and tools. Fun Fact: Did you know that Alteryx started out as a Spatial Software (before specializing on advanced analytics automatic) and hence the name comes from "Altering Y and X coordinates" or "Alter Y, X"?
One neat feature is to create areas or regions around a certain point. For example, you have hospitals spread across the city and you want to calculate how many people live within the "service area" of that particular hospital. Alteryx can draw a circle with a specified mile (or kilometer) radius around the hospital and you can calculate how many people live within that area.
To accomplish this, we use the Trade Areal Tool.
However, there are some use cases where you don't want to draw a circle because you don't want to include the area directly around your center point. You may hear it referred to as a donut area or a polygon with a hole or island in it.
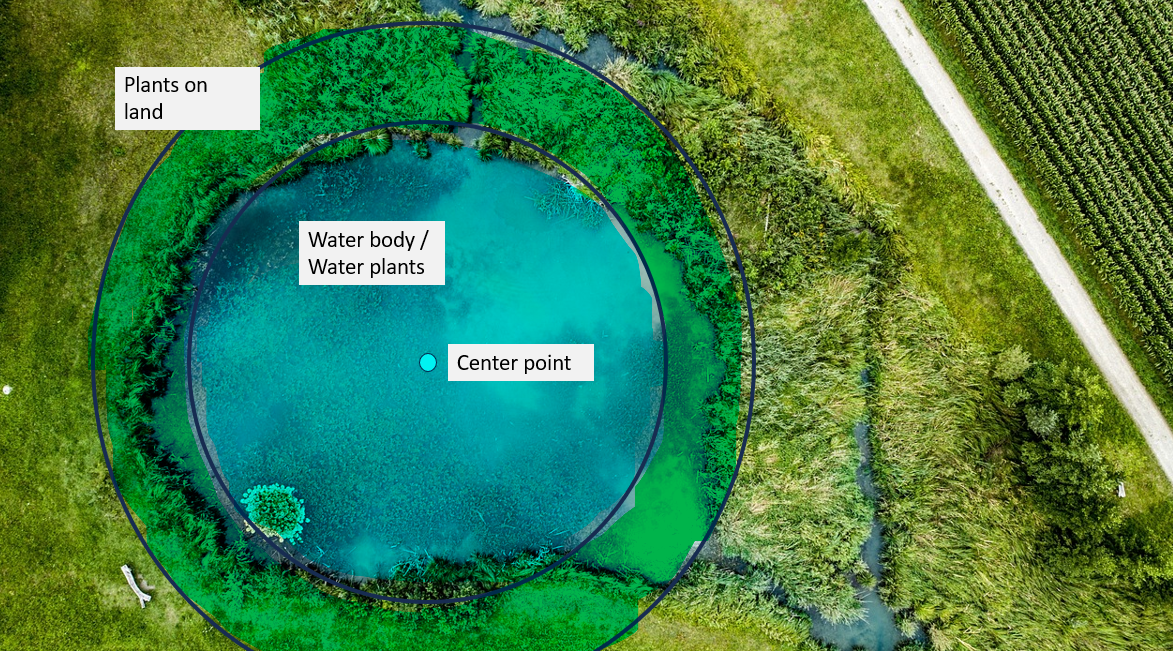
For example, let's say you you have a map of lakes across Germany. Your dataset gives you the inner most point of the lake. You then want to calculate the plant coverage around those lakes. However, you only want to consider the plants on land and not the ones that grow within the lake. In this case, you want to take a certain radius around your innermost lake point and not include that in your area and then only focus on the area outside of that. The following image demonstrates that.
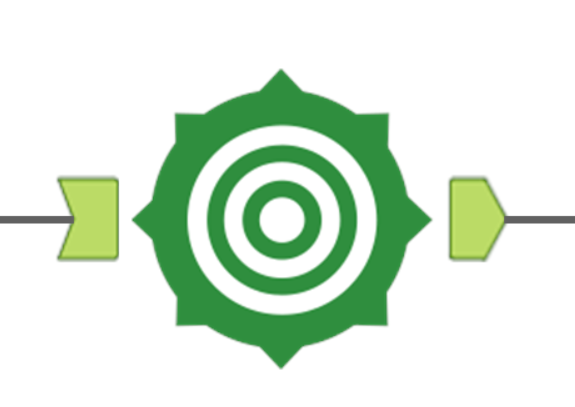
To achieve this, we drag the Trade Area Tool into the view (coincidentally, the tool icon already shows us that both circles and donuts are possible with this tool).
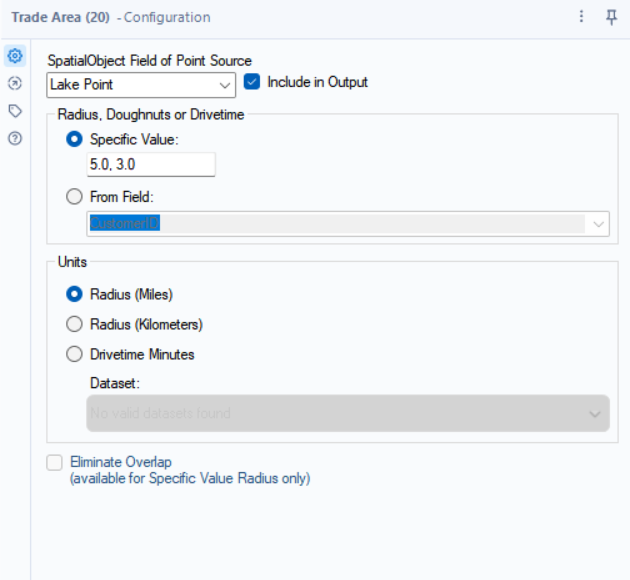
We then configure the tool by inserting our lake center point and providing 2 specific values to create our donut, separated by a comma. The first value represents our bigger area (think about the donut with a filled hole or your total area). The second value represents the area of the hole from your center point. So we always want to list the values from the largest radius to the smallest, such as in the screenshot of the configuration window below.
If you want to create multiple rings, you can also add more values, each one separated with a comma. For example, you may have a hospital as your center point and you want to know the number of residents within 5, 10, or 15 miles. Here again, list the specific values from the greatest (the outermost radius) to the smallest (the innermost).
When you now run it and add a browse tool to it, you can see the multiple circles on top of each other.
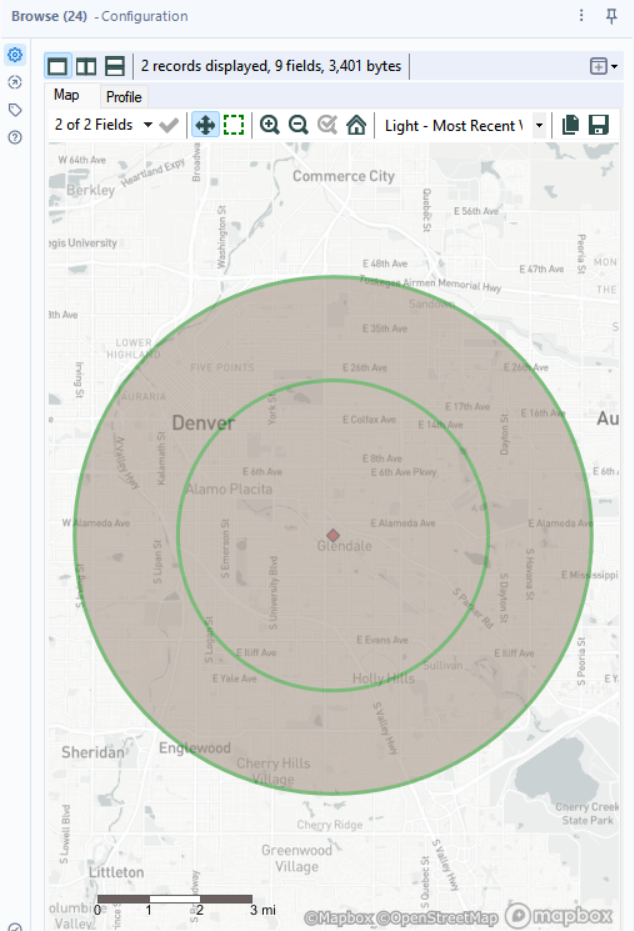
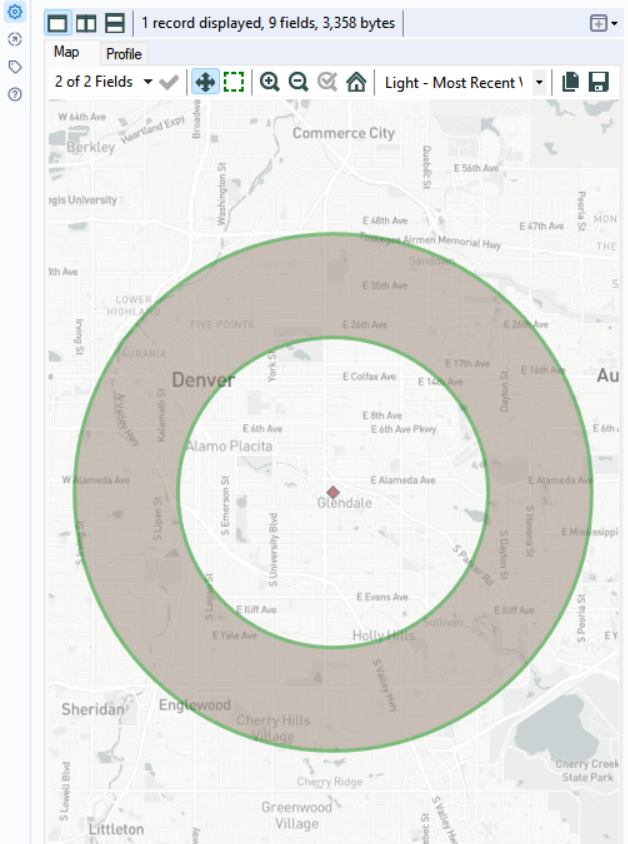
For this blog post, I created two circles around a specific point in Denver. One with a 5-mile radius ("donut with filled hole") and one with a 3-mile radius (the donut hole"). The output will look something like this:
Note that the circles are just layered on top of each other. If you want to create a proper ring and exclude the innermost part you can adjust your specific values in the configuration tool as ranges, e.g. 3-5.
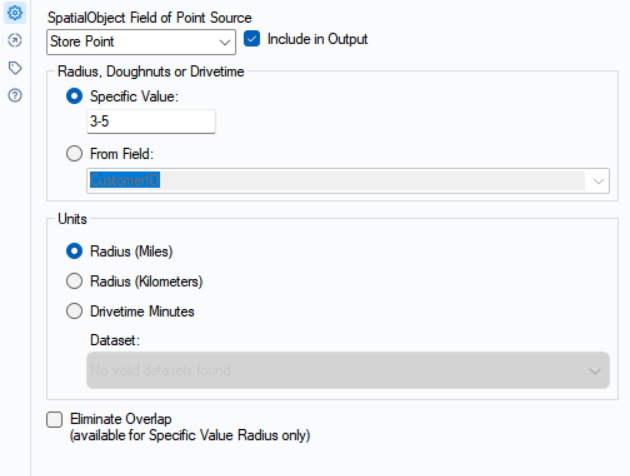
Important to note: Now the order does not matter anymore. You can specify it as 5-3 or 3-5 as we do not have layers overlapping each other any more. The output will now look like this:
And there we have it. If we go back to the lake example, you could now calculate the plant coverage in only this area.
Lake Image by Micha Sager from Pixabay, modified by Lisa Hitch
Screenshot taken by Lisa Hitch in Alteryx Designer 2023.1