4th day of our dashboard week at the DS was focused on using a different software than we are used to - Power BI. Our task was to use some sample data to come up with a KPI business dashboard.
My planning started with reading the articles about the data to understand how to download it, what's the data is representing and how the relationships between the tables are set up. I found a very detailed guided in the above link.
Next, I looked for some inspiration on Tableau Public for KPI dashboards and created a rough sketch.
The following step was the biggest challenge, learning how to use Power BI. I spent some time skimming through YouTube videos on Power BI basics and hacks. The rest of the time I just spent building the dashboard and formatting it.
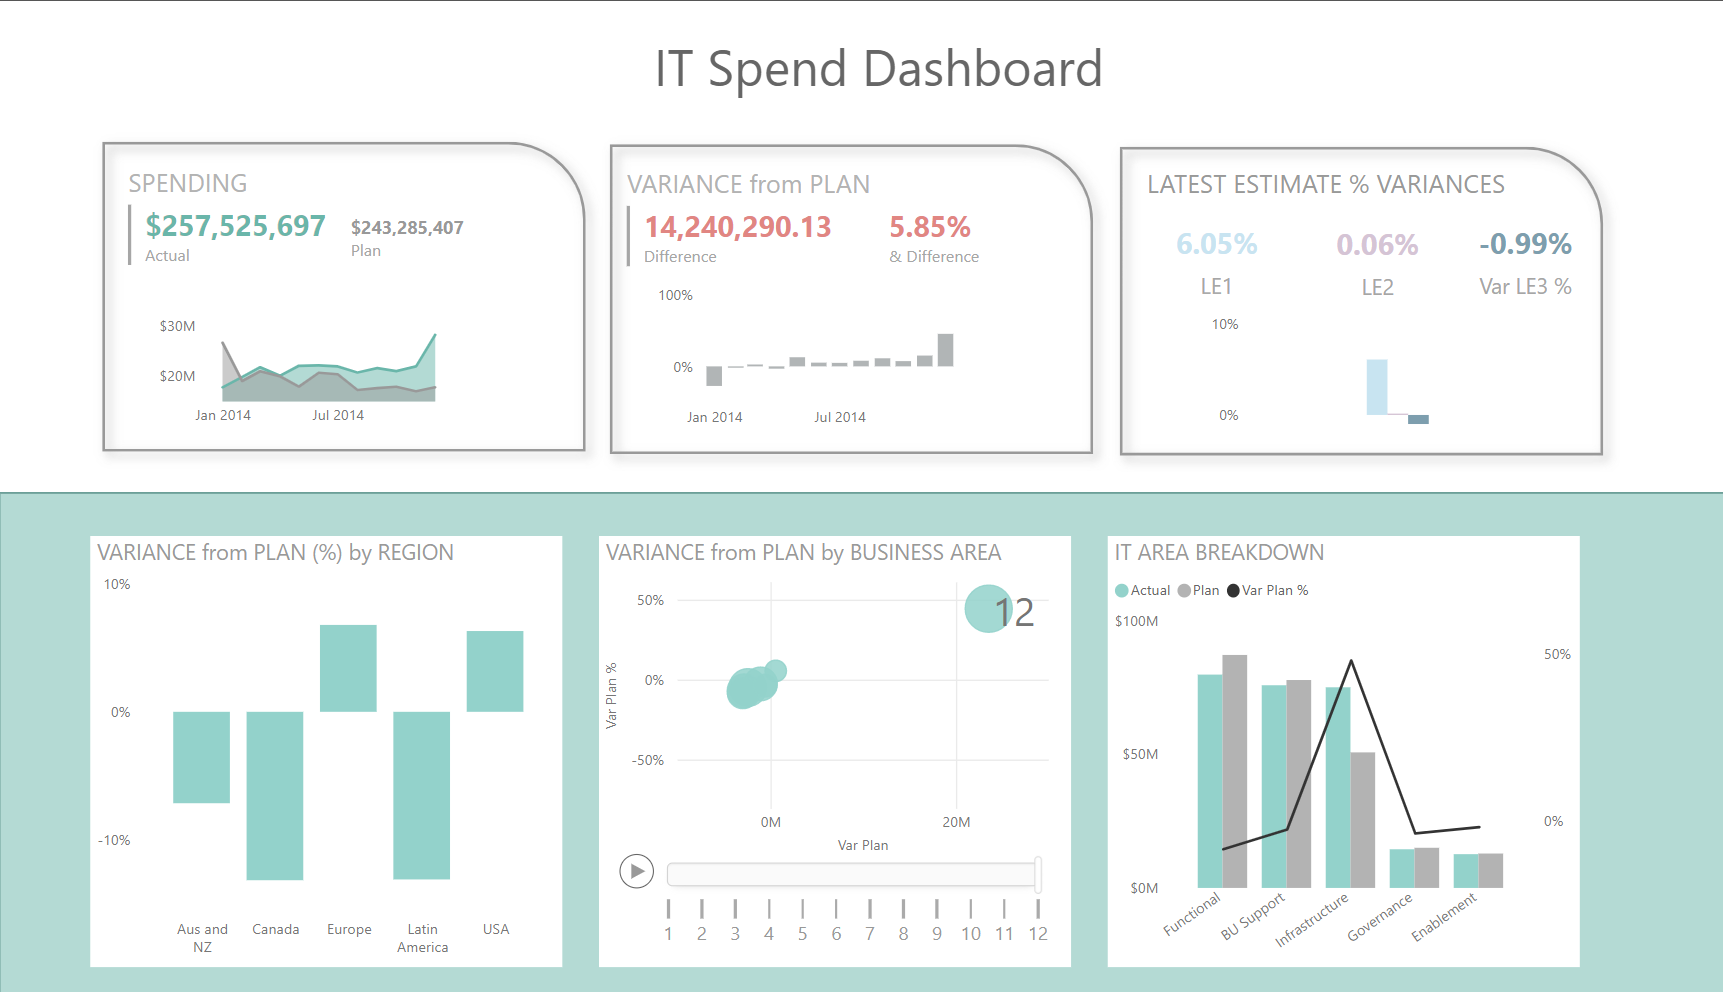
Here's the final result: