


Today we were challenged to build a dashboard using US Census Data related to tobacco use. The first problem I faced was handling the .dat file format the data came in. The solution was the set the Input Data tool in Alteryx to read it in as a fixed width, where the width was set to 701 characters (the maximum number of total characters in one record). Configured this way, Alteryx read in all the data from each record into a single cell. Since each record contained answers to around 200 census questions, there was then a lot of manual work to pull out the relevant data from each field. Since we only had the morning to work on this, I chose a handful of basic demographic fields (age, sex, income, etc) along with a few fields related to tobacco usage that might answer the question I was investigating:
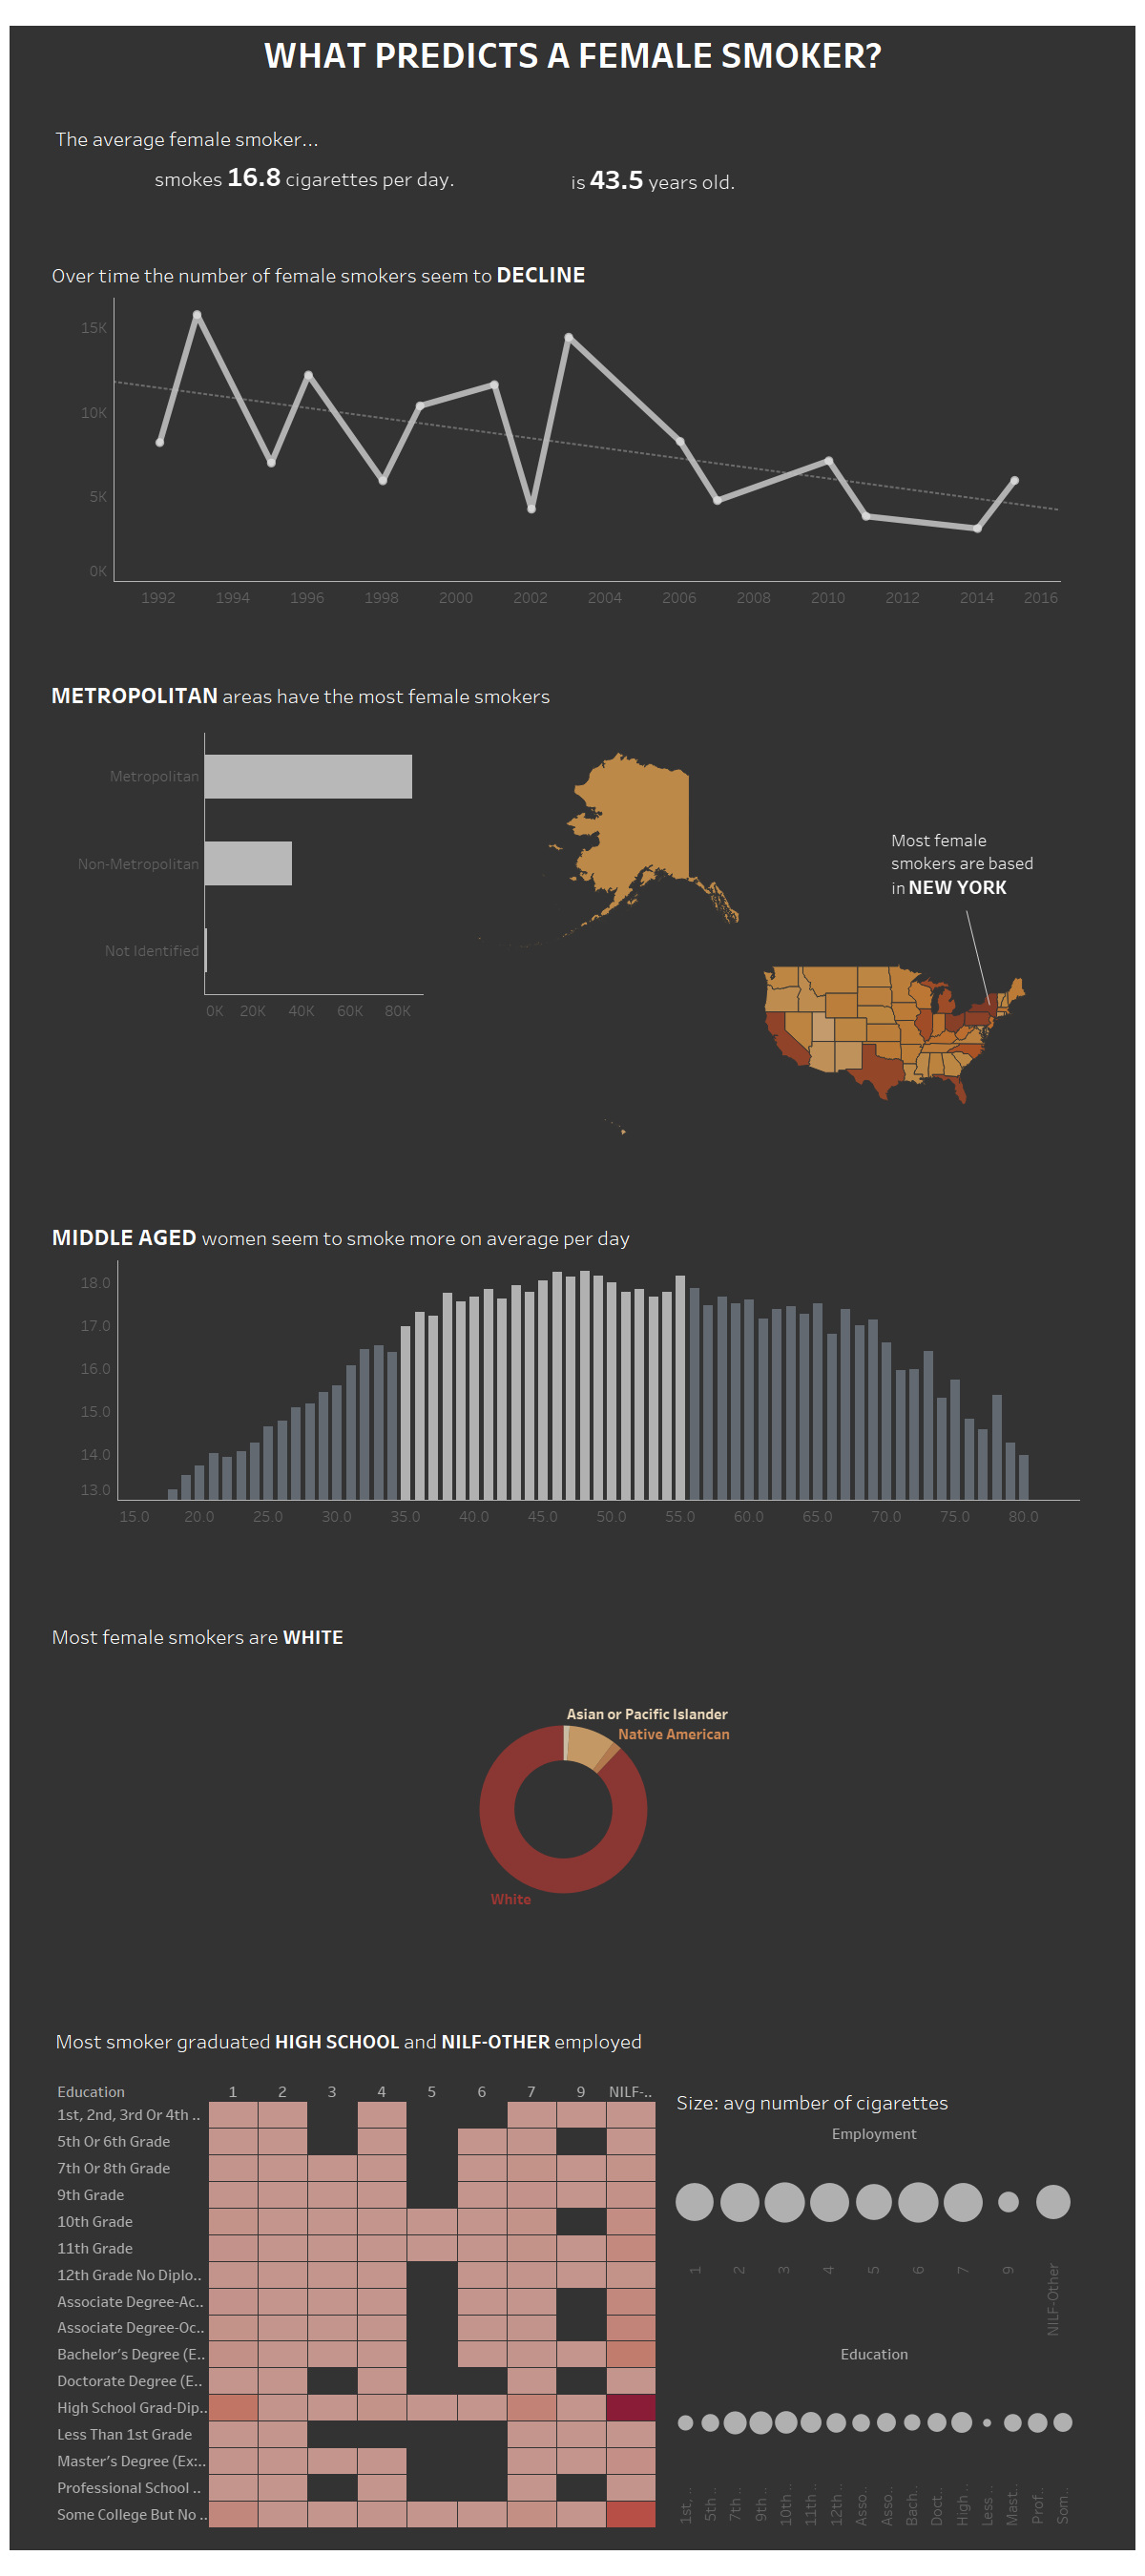
What factors predict female smoker?

I tried to replace the coded values in the dataset based on the dictionary provided on the data source website but I had some difficulty when I transferred the output into Tableau (there were values in columns that were not there in the Alteryx output).
- I only had a question as a plan so I was told to have a more specific plan before building a dashboard