


Recently I decided to spend some time creating a #VizForSocialGood using the data on lions from the Kevin Richardson Foundation. The data consisted of a bunch of (scary) statistics looking at the loss of lions, which is both surprising and sad. The Foundation supplied a number of pictures to go with the data, which I used to make into custom shapes for a lifecycle, the final result can be seen here.
I thought I’d talk you through what I did to make them and then add them as custom shapes in Tableau.
Making custom shapes for use as datapoints
The majority of the time for this was spent trying to work out how to make little circles out of the pictures provided. I managed to achieve this using PowerPoint, and it can also be done in Word as follows:
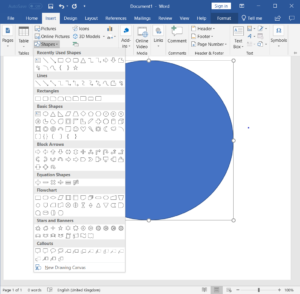
- Open a new document and create a shape of your choosing on the page, from the Insert> Shapes menu.
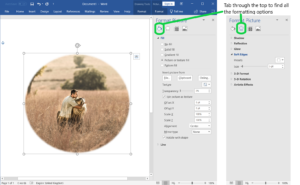
- Fill the shape with the Picture
- Right click on the shape, choose “Fill” > Picture, and browse to the location of the picture on your computer.

- You then need to right click and format your shape. You’ll probably want to tick “Tile picture as texture” and centrally align the picture in the shape. You can then spend an hour or two adjusting the alignment, changing the size of the picture to fit in your custom shape, and choosing the exact number of pixels to blur the edges by. By far the hardest part.
- Save your custom image in the shape Folder of My Tableau Repository. It’s useful if you give the subfolder a logical name here, relating to the icons you’ve made, e.g. Lion Shapes/Emoticons etc.
C:\Users\(Your Name)\Documents\My Tableau Repository\Shapes\(Whatever you call your shapes)
Once your shapes are safely saved in your repository, you can simply open and close Tableau, reload your shapes and they should be available for use.
You can then put your pill onto Shape in the Marks Card, and allocate your custom shapes to the dimensions you want.
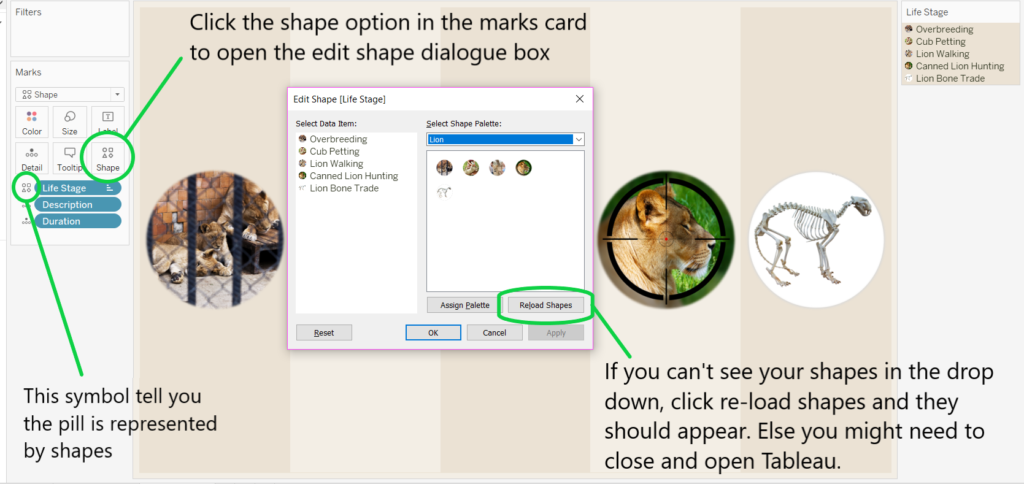
To set individual shapes as default for certain values in the data, you will need to right-click on the pill, choose Default, Shapes, and allocate them to each value. 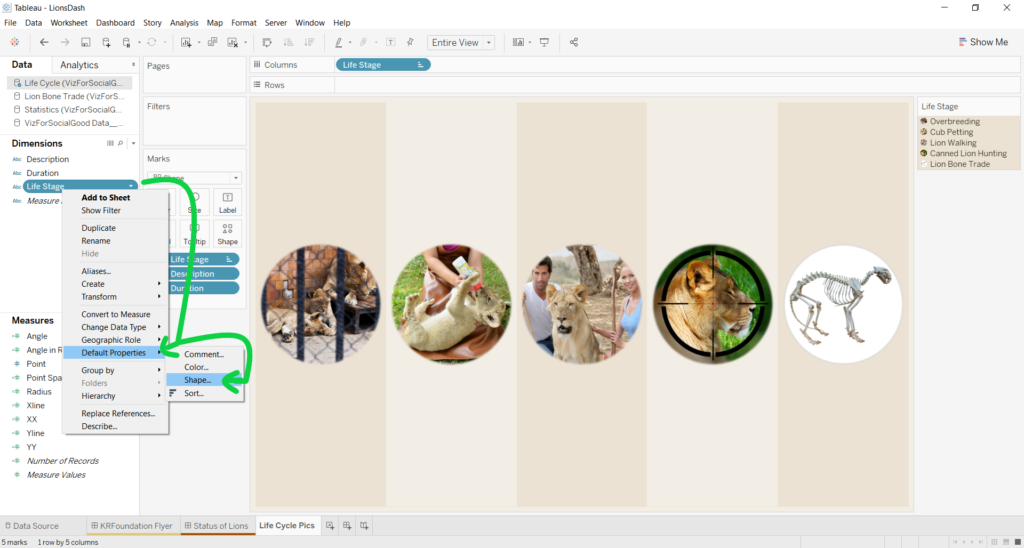
If you were inspired by Andy’s Cat Map during his recent webinar, you can use the same techniques of adding the cat shapes to your Repository. Get creative with this, make whichever shapes you want and start playing around!