


Today in training, DSNY 11 practiced taking raw data and reshaping it using SQL into Fact and Dimension tables, to be uploaded into Tableau Server.
I chose to use bird sightings data from the site ebird.org.
My process and what I learned:
My task today was to find a single table with over 1000 records and enough fields to be meaningfully reshaped into a set of dimension tables and a single fact table. Throughout this process, I came to understand that having your data in the form of fact and dimension tables is far superior to having all your data in one table.
Sure, a single table may be easier to understand, since the rows are at the same granularity, and every detail is included on every row.
However, having your data broken up into a fast growing fact table surrounded by slower growing dimension tables means that less space is used to store repeatable data values. For long term projects concerned with scalability and sustainability, this is definitely the way to go. A site like Ebird.org which receives constant new sightings likely holds data of a significant size, which would benefit from a disciplined data structure such as this.
From a data analytics standpoint, it is also more efficient for Tableau, as having the data separated out into different dimension tables means that each view doesn't have to scan through a large table to find the specific information you are looking for, instead only pulling in whatever dimension table is absolutely relevant for that chart.
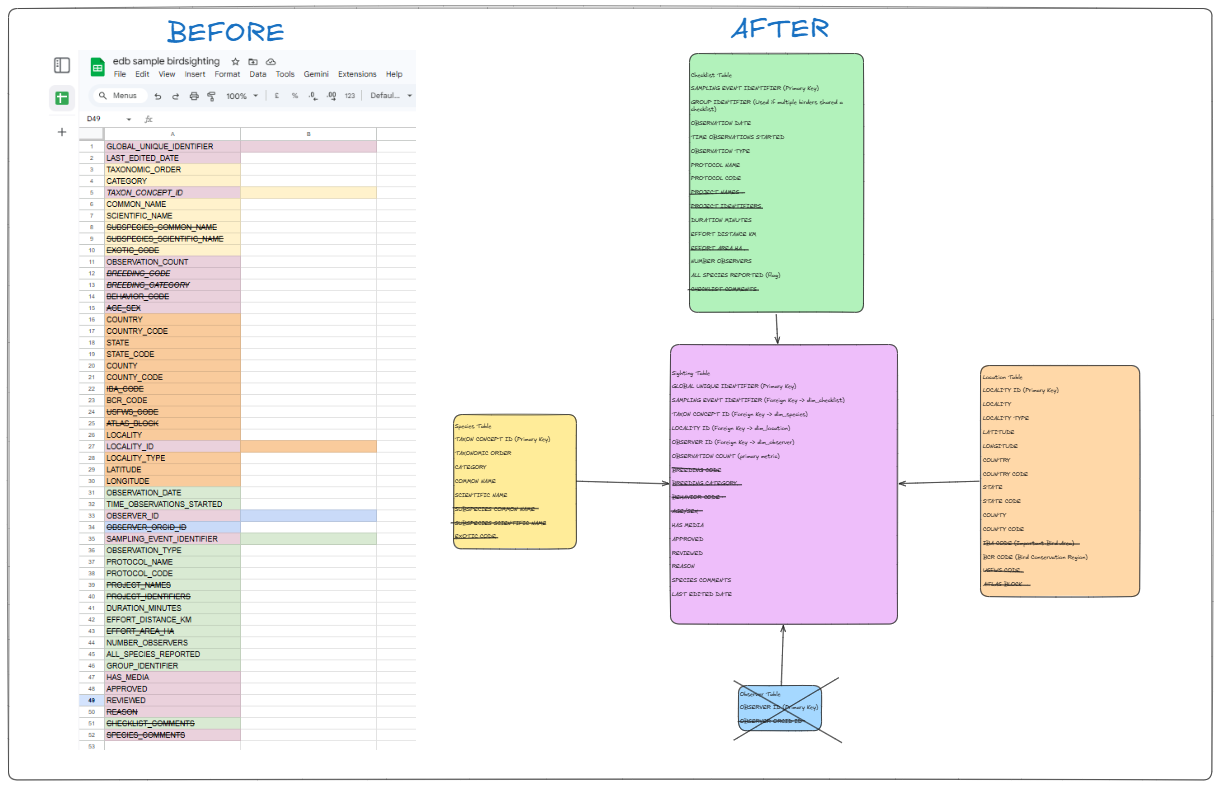
I used an LLM to help me contextualize the field names from the raw table and figure out how to group them into different dimensions. As I have never personally used Ebird, I learned that observers submit their observations in a form, where they can include multiple different sightings. Each table took responsibility over one kind of ID, which allowed me to create 4 different tables. The fact table would hold all unique sightings, and there were 3 dimension tables: 1 for bird species, 1 for localities, and 1 for information about the forms the observers use to submit the sightings.
My blockers along the way and how I circumvented them:
Initially I had some trouble finding the dataset I wanted to work with. Ebird needed a request to be approved to see the full dataset, so I was only able to get my hands on a sample dataset of bird sightings in Alabama in March. For the purposes of building out the schema though, this was fine.
After bringing the raw table into Snowflake, some of the fields didn't have enough filled data to be useful for analysis ( > 95% null), so I dropped them. I am assuming that this is due to the fact that I only have a sample of the data for the location and time range. Because I had to drop a few fields, I ended up scrapping a dimension table planned to hold data about observers, and the only remaining Observer relevant field was the Observer ID which remained in the main fact table.
I had trouble connecting my Tableau Workbook to Snowflake today in order to build out the data model using my newly formed tables, but I managed to download csv files directly from Snowflake in order to build out my data model before finally uploading it to Tableau Server.