


Are you a sports fan? I'm not. I understand however the binding, inspiring force that sport represents. Some people meet spouses at sporting events, for others its a primary pastime, even a reason to live. For Germany, the Bundesliga has now been around for 60 years. So its stands to reason that football (or soccer, if you please) is a rich topic to analyze.
It's Dashboard Week here at the Data School, where in our final week of training we soon-to-be-graduates are given a topic or dataset and tasked with putting together a whole dashboard - every day. That includes the start to finish process of data prep, wireframing, dashboard creation, presentation, and writing up a blog like this one.
Today we were pointed toward the Bundesliga club stats website and told to go grab and make something out of the last 20 years of data there. I'll walk you through how I spent my day.
Webscraping in Alteryx
Taking the data of each team during each season required not only successfully navigating the site's html and using Regex to parse the correct information out, but also inventing some way to deal with the need for each season. As you can see, there's a drop down below the "Table" title allowing onsite navigation between various seasons. The html doesn't account for that.
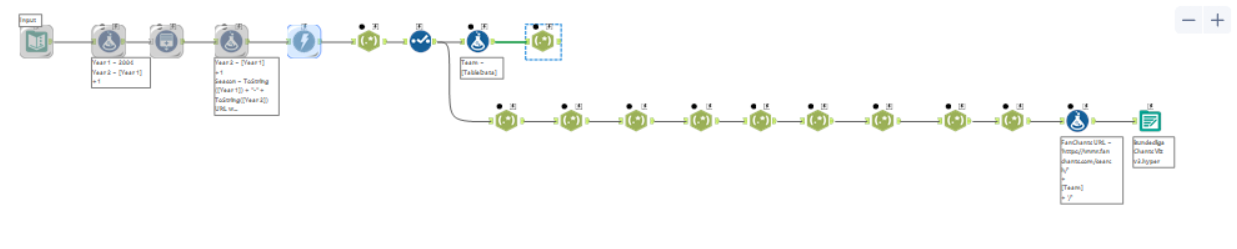
Fortunately, using the Generate Rows tool in Alteryx saved the day. By setting up a simple set of formulas and using that tool, I created a new field containing the last 20 seasons. Even more conveniently, the URL of this website allows for the season to simply be tacked onto the end. Once I had gotten a URL for each season into its own row, I used the Download tool to separately scrape each season's table.
That was the easy part!
I probably spent about 85% of my overall time in Alteryx. Webscraping, while a keen interest of mine, isn't something I've had lots of time to practice thus far. Navigating walls of html text for a granular pinpoint of information can feel like using a metal detector to find a penny in the middle of a forest... at midnight.
Nonetheless, I made it through the fire and flames to that which was beyond. I used a slew of Regex tools to first tokenize each "stat" for each team to its own row. I also decided to put together a separate URL to fanchants.com, for a reason I'll elaborate upon soon.
Wireframing
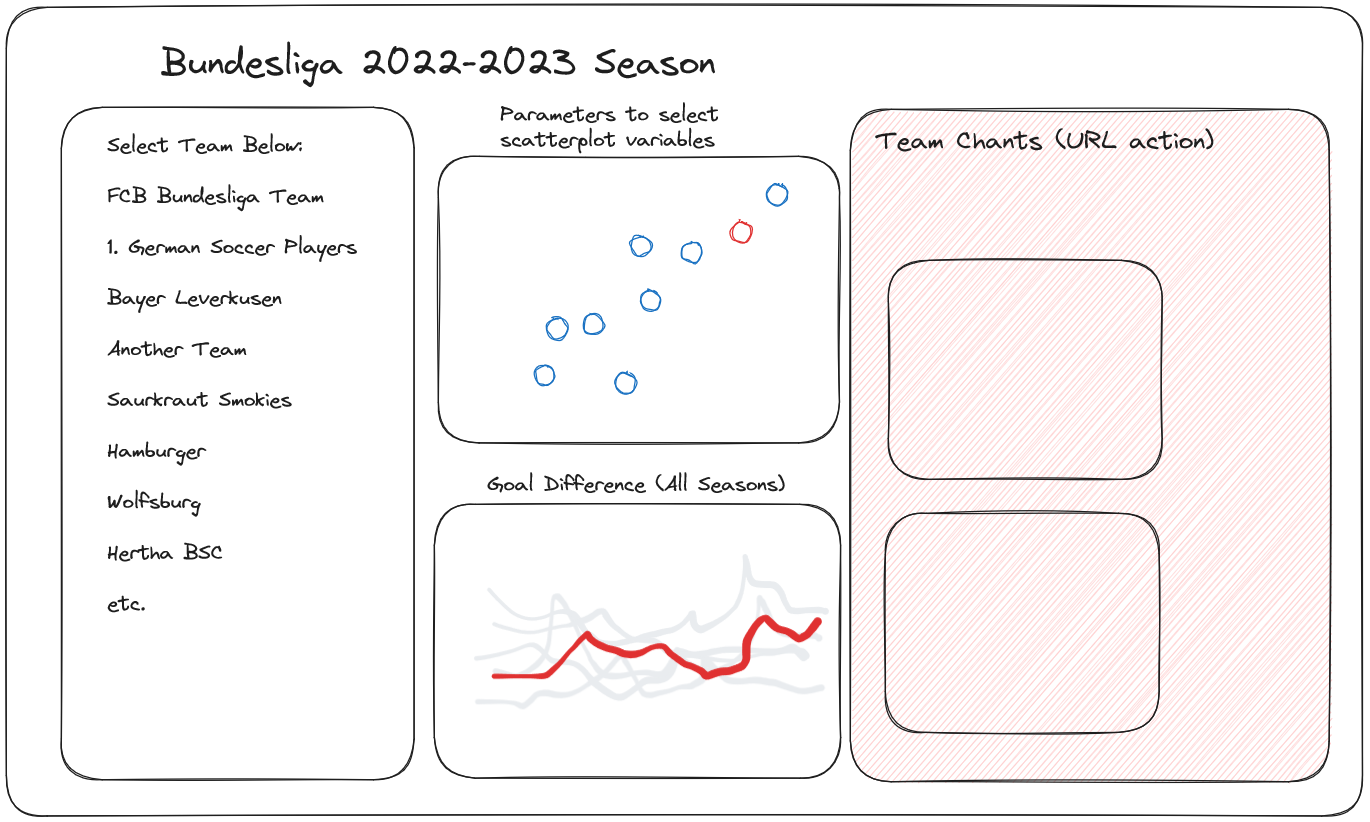
Using excalidraw, I drew up a sketch of a little dashboard "app" I had in mind. Since I know next to nothing about football, I decided to create something that might be useful to people like me, and emphasizes the zeal that others have for the sport.
My dashboard would allow the user to select any of the teams from the season they had selected, see some broad stats about that team's performance compared to other teams, and, most flashily, would feature a Web Page Object that navigates to the FanChants website and allow you to hear how the fans of that particular team cheer them on.
The Dashboard
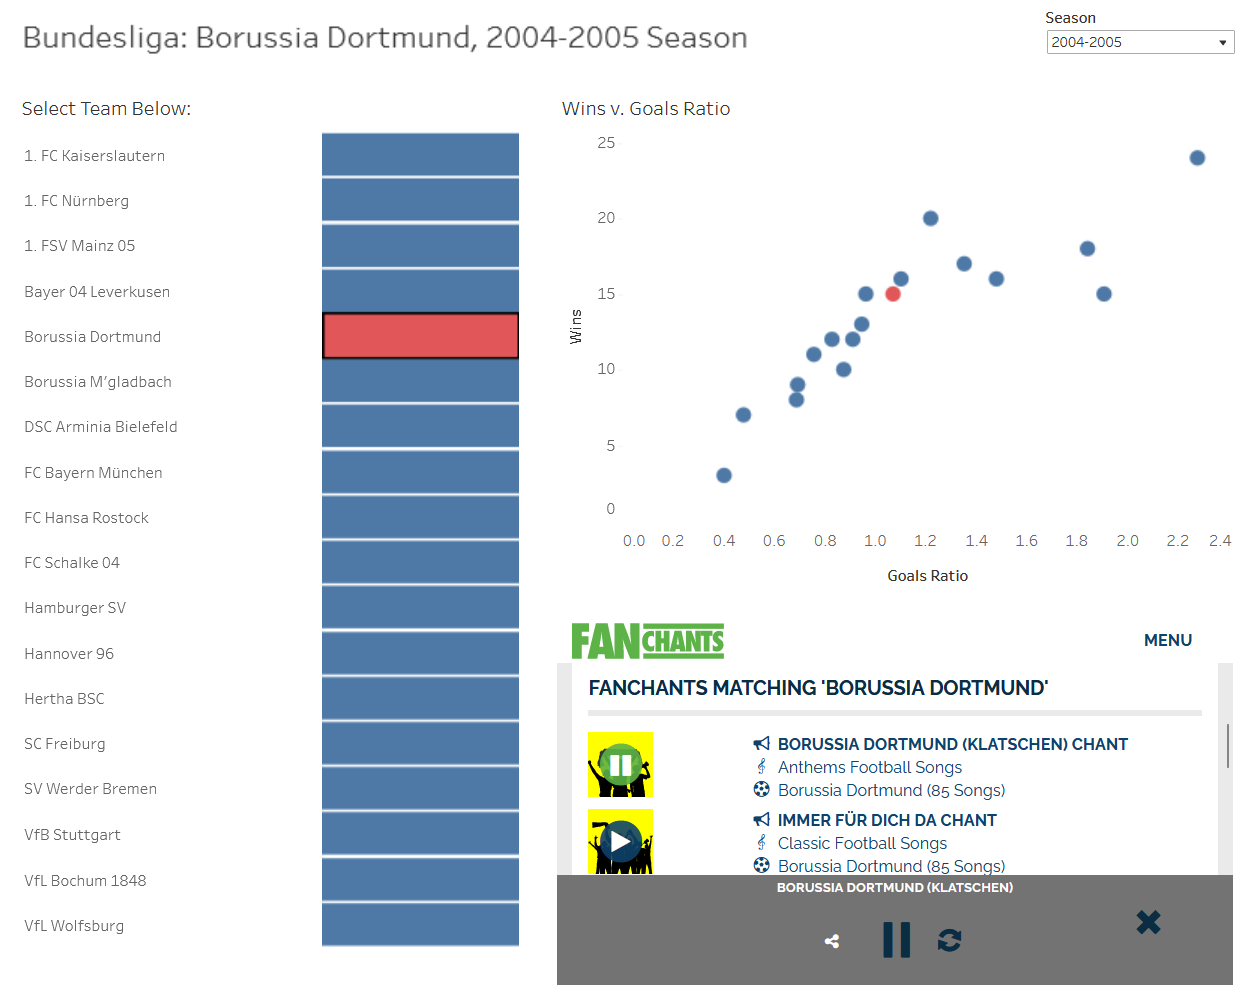
For the remaining time I had - which was about an hour - I was able to throw this together.
I'm pleased that I was able to not only get the dashboard done mostly as intended, but also learn how to create custom web page objects in Tableau within that time. You can visit the dashboard on my tableau public here!