KPI Dashboards. We love them because they show us heaps of business intelligence all at once. It can however get quickly overwhelming to have dozens of KPIs on a single dashboard. Too much of a good thing, such as tuna on a tuna sandwich, can turn the good thing into a bad thing. As George St. Geegland and Gil Faizon would say, that's just Too Much Tuna!
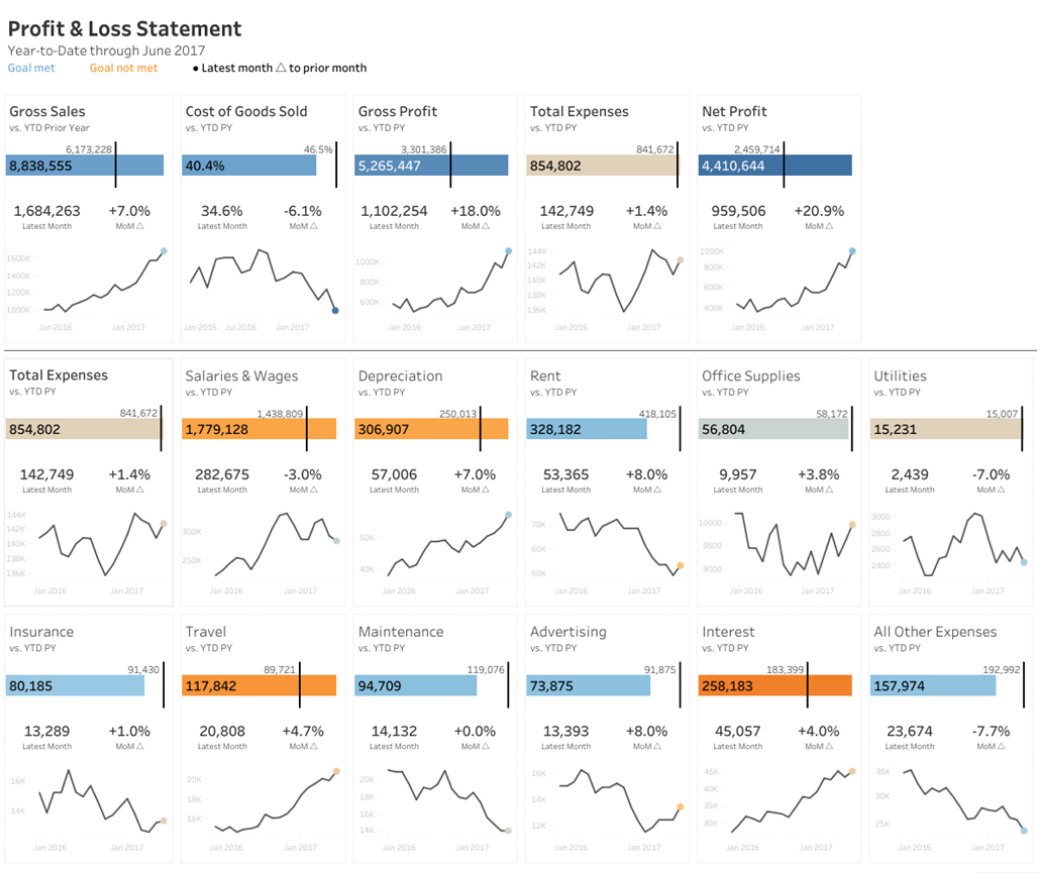
In addition to being overwhelming to our human senses, too much information can also detract from Tableau's performance. It can take a long, long time for Tableau to query every single sheet that appears. In the dashboard above case there would be 68 queries happening. Depending on the data source connection and your machine's underlying hardware, you could be twiddling your thumbs for a long time just waiting for the dashboard to open.
One solution to performance issues (there are many) to is to group KPIs together by relevance into separate dashboards. Perhaps Sales could be its own category, Expenses another.
Another thing to keep in mind in terms of dashboard performance is the number of filters you have on. Filters are also like tuna: not too much! If you have five separate dynamic filters on all at once, keep in mind that Tableau will have to generate a query for each of them which slows everything down even more. As a general rule of thumb, your Tableau dashboards should never take more than 4 seconds to load any changes after a click. Keep in mind Tableau's "order of operations" for filters:
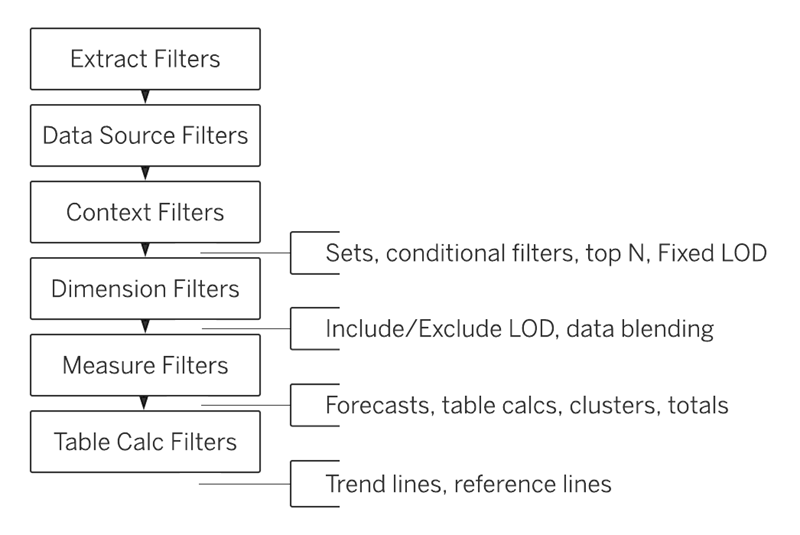
Tableau will apply the different filter types in the order on the left. The further down the filter type is on this hierarchy, the more it will have to be queried. If you're dealing with performance issues, a possible solution could be to eliminate or substitute as many table calc filters as you can.
Be sure to check out other data schoolers' blogs on this topic on your way to becoming a Tableau expert!