


It's Dashboard Week here at the Data School, where in our final week of training we soon-to-be-graduates are given a topic or dataset and tasked with putting together a whole dashboard - every day.
That includes the start to finish process of data prep, wireframing, dashboard creation, presentation, and writing up a blog like this one. This fair Friday we were tasked with analyzing data about school cafeteria inspections in NYC, provided by NYC Open Data.
So... how do you manage to complete the creation of an analytical process when your one day becomes half a day? Well, dear reader, through something I like to call skeleton scoping. Let me tell you my story.
The Beginning
New York City, home to the U.S. branch of The Information Lab, probably floods about once or twice per year on average, though I'd love to see the numbers on that. When the city floods, the subway, our subterranean network of trains, often partially floods too. Even if only one station floods, entire train lines will likely have to stop running. Add to this the MTA's existing unreliability (despite the hard work of its employees) and you have an absolute spaghetti-plate-shattering-on-the-floor mess. And that's what happened today.
I arrived at the office around 9:45am, flustered, wet, and not ready to think about data. By the time I'd dried somewhat, checked in with my colleagues, and caught my breath, it was roughly 10:30am. I knew I had to get started on something, so I did my best to pair my interest in predictive modeling with linear regression with the data we were given for the day.
Creating a Linear Regression Model
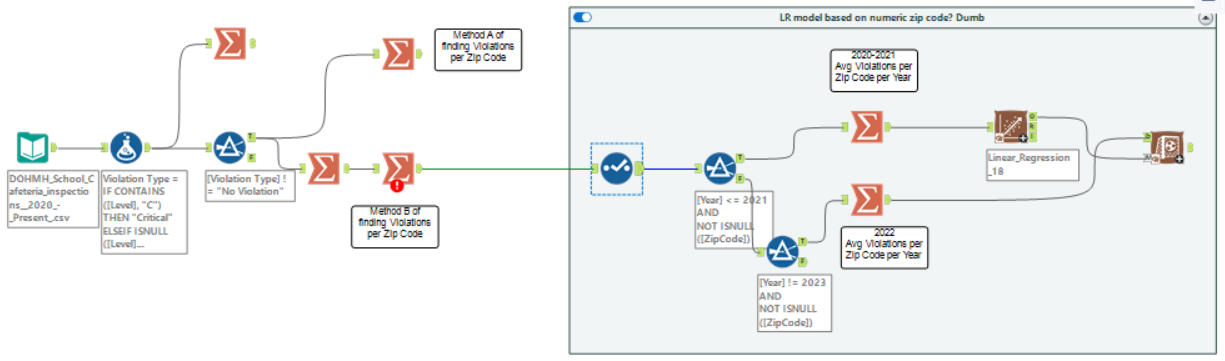
My hope was to have a model that could predict how many violations school cafeterias would have within a zip code in future years based on previous years of data.
Unfortunately after taking a couple hours to understand the data well and put this together in a way that made sense, I realized my idea had a flawed premise: zip codes are categorical, and linear regression modeling with these tools needs (I believe) numeric data to function. Uh oh.
Going Home
The rain wasn't letting up. The trains were not really coming back online. Given the city's unpreparedness for days like today, huge globs of crowd would inevitably clog the subways during rush hour. Our management kindly let us know that it was okay to avoid that - to go home and continue working from there. Most of us in my training cohort took them up on that.
Of course, commuting from roughly 1:45-3:00pm meant almost another hour and a half gone. Presentations were scheduled for 4:00pm. On the train ride home, I pondered ways to salvage something with the remaining hour I would have at home.
Skeleton Scoping
You know that Microsoft Excel advertisement from 1990? Where the guy literally plunks together an executive-level presentation within a single elevator ride? Well, that's essentially what I did. Only difference: I had the power of Tableau.
I thought to myself, "okay, I can't make a cool machine learning model, and I can't do anything beyond basic analytics. What is still going to be interesting and useful to show?" Because of the training I have under my belt, once I know what I want to show, I know how to build it out. So I laid out a barebones (pun utterly intended) path for myself:
- Make a map of the zip codes and the health violations
- Include a time series of health violations over time
- Have it all be customizable by a few filters.
It was 3:30pm. Go.
... By 4:00, it was done.
The Presentation
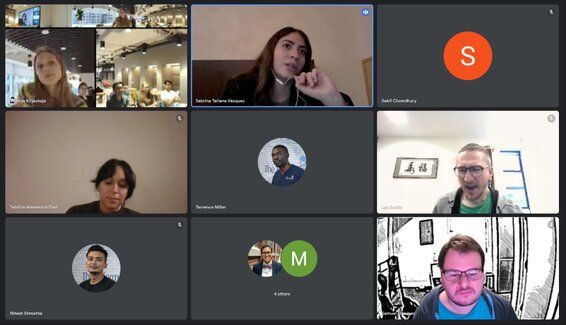
We presented from home. I had my stuff ready to go. I presented it. Most importantly though, I told the story I just told you. I "sold" the way I spent my time. While I did have a good, functioning dashboard prepared, what was most important was describing my thought processes, my attempts at doing something bigger and how the scope got limited, and how I was able to put something together anyway.
Afterward, our coach Valerija emphasized to DSNY5 (the training cohort after ours) that my presentation was a masterclass in keeping a presentation positive in light of disastrous circumstances. In other words, I did it.
Here's the dashboard, if you were wondering:
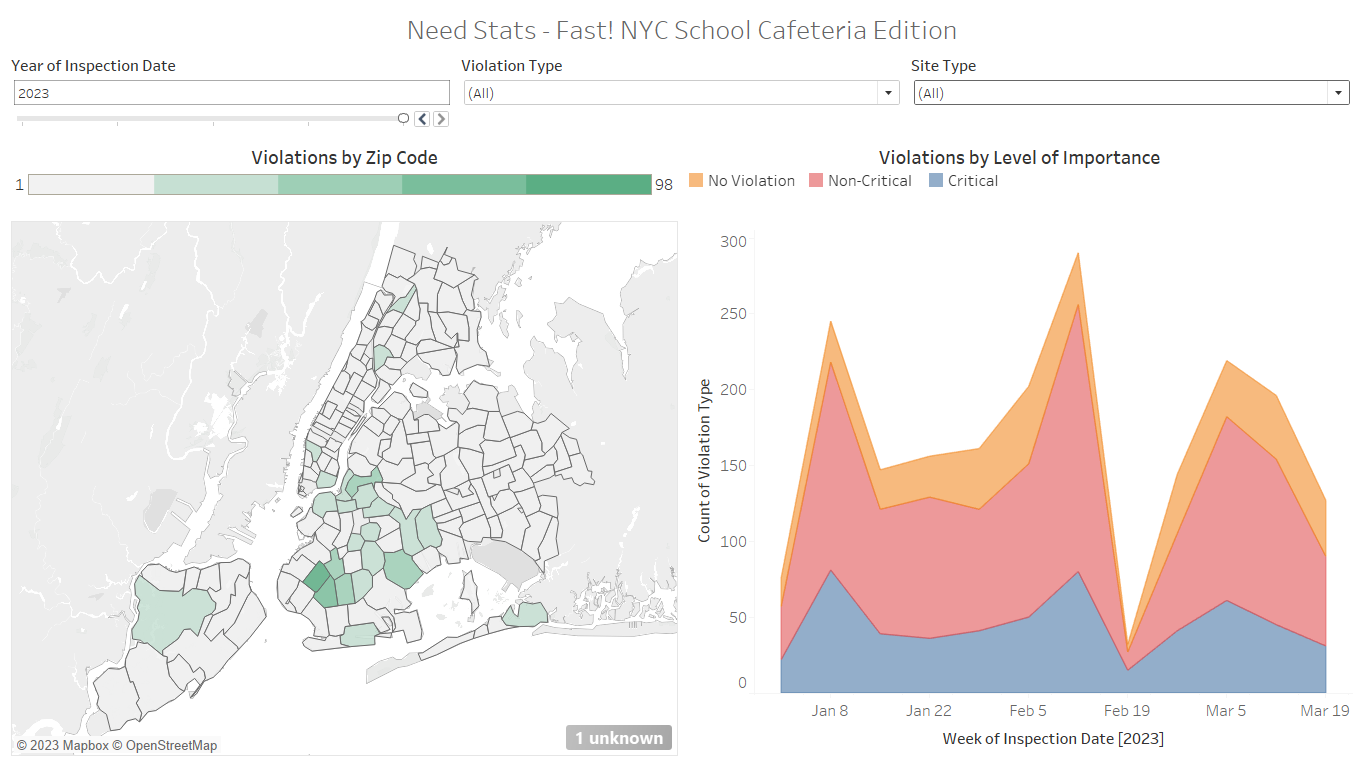
I imagined my end user was someone who just needed some "fast stats" before they headed into an executive-level meeting. This granted me some credibility as I presented as well.
Moral of the Story
Scope down in the face of impending deadlines. Your presentation will be just as good and you'll thank yourself later.