


Fellow Tableau wizards ... by the power I possess, I shall herein bestow upon you the deep astral knowledge of ... STATISTICS ... and later on, the extraordinary capacity to construct a Box & Whisker plot ... beware neophyte, ye have been warned ...
First, let it be known what constitutes a median. This knowledge of course is covered in basic wizard training, I am aware. Nonetheless, we must review - purely for our safety - the spell will likely consume our souls if we are not precise. Within a field of numeric data, if every value were to be lined up in order (either ascending or descending) the median is the value located exactly in the middle of that list. If there is an even number of values and thus two values in the middle, the median is thus found by averaging these two numbers. An example:
A field of numbers: 17, 4, 7, 39, 7, 9, 13
Line them all up in order: 4, 7, 7, 9, 13, 17, 39
Median: 9
Here is an additional example where the field has an even amount of values:
A field of numbers: 17, 4, 7, 666, 39, 7, 9, 13
Lined up in order: 4, 7, 7, 9, 13, 17, 39, 666
Average the two middlest figures: (9+13)/2 = 11
Median: 11
Excellent. Now that our review is complete, we may journey deeper. Next we will discuss the meaning of quartiles, as well as Interquartile Range (IQR).
A quartile is a simple concept. In an ordered numeric field, as we said, the median is the value in the middle. Well, the quartiles are located at every fourth. Quartile 1 (Q1) is one fourth from the lesser end, Q3 is one fourth from the greater end, and Q2, located one half from either side, is simply the median itself. Each quartile is a percentile: the 25th, 50th and 75th percentiles respectively. Mathematically, their positions are given by the following formulas:
n = number of values
Note: if there is an odd number of values, we use (n+1), otherwise we simply use n. The following assumes an odd number of values:
Position of Q1 = (n+1)/4
Position of Q2 = 2(n+1)/4
Position of Q3 = 3(n+1)/4
An example:
4, 7, 7, 9, 11, 13, 17, 23, 31, 39, 666
n = 11
Position of Q1 = 3, therefore Q1 = 7
Position of Q2 = 6, therefore Q2 = 13
Position of Q3 = 9, therefore Q3 = 31
Another note: if the math returns decimals for a quartile position, be sure to use whichever value is the closer to the median from that position.
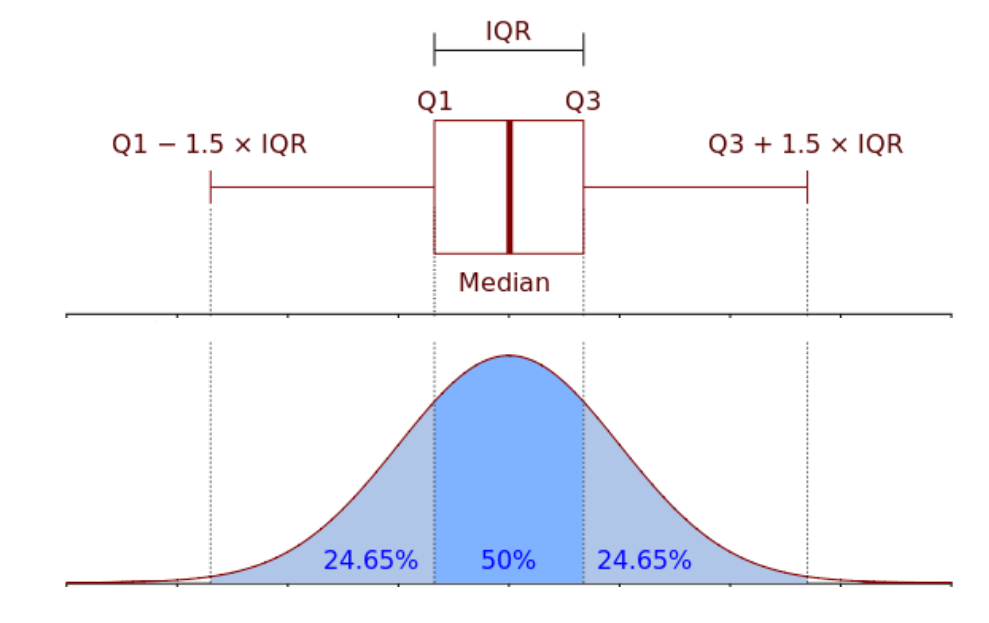
Finally, we must cover Interquartile Range before our minds are fully ready to cast the spell and create the box and whisker plot. The IQR simply represents the range between the positions of Q1 and Q3, whose "length" is given by Q3 - Q1.
IQR = Q3 - Q1
50% of values will fall within this range. 25% will fall to either side outside the range.
Box & whisker plots are used to visualize values that fall within this "normal" range and those that fall outside it. Furthermore, it is used to locate outliers. Values that fall on the outside of the "whiskers" are considered outliers - that is, given how all the values in the dataset are, it is very unlikely that any particular one will fall outside the whiskers.
To determine the postion of these whiskers, we follow the formulas:
Position of Lower Whisker: Q1 - (1.5 x IQR)
Position of Upper Whisker: Q3 + (1.5 x IQR)
Yes ... that should conclude our familiarization with the statistical content. Now we are ready ... now begins the great and terrible spell. Come with me, my dear wizard ... we shall concoct a box and whisker plot that will HAUNT users with its unspeakable statistical appraisals and severe visual profundity.