Hey P.! Ever wondered what your Spotify listening habits say about you? Well, you are about to uncover some fascinating insights with the dashboard I built 😉
Let's walk you through it.
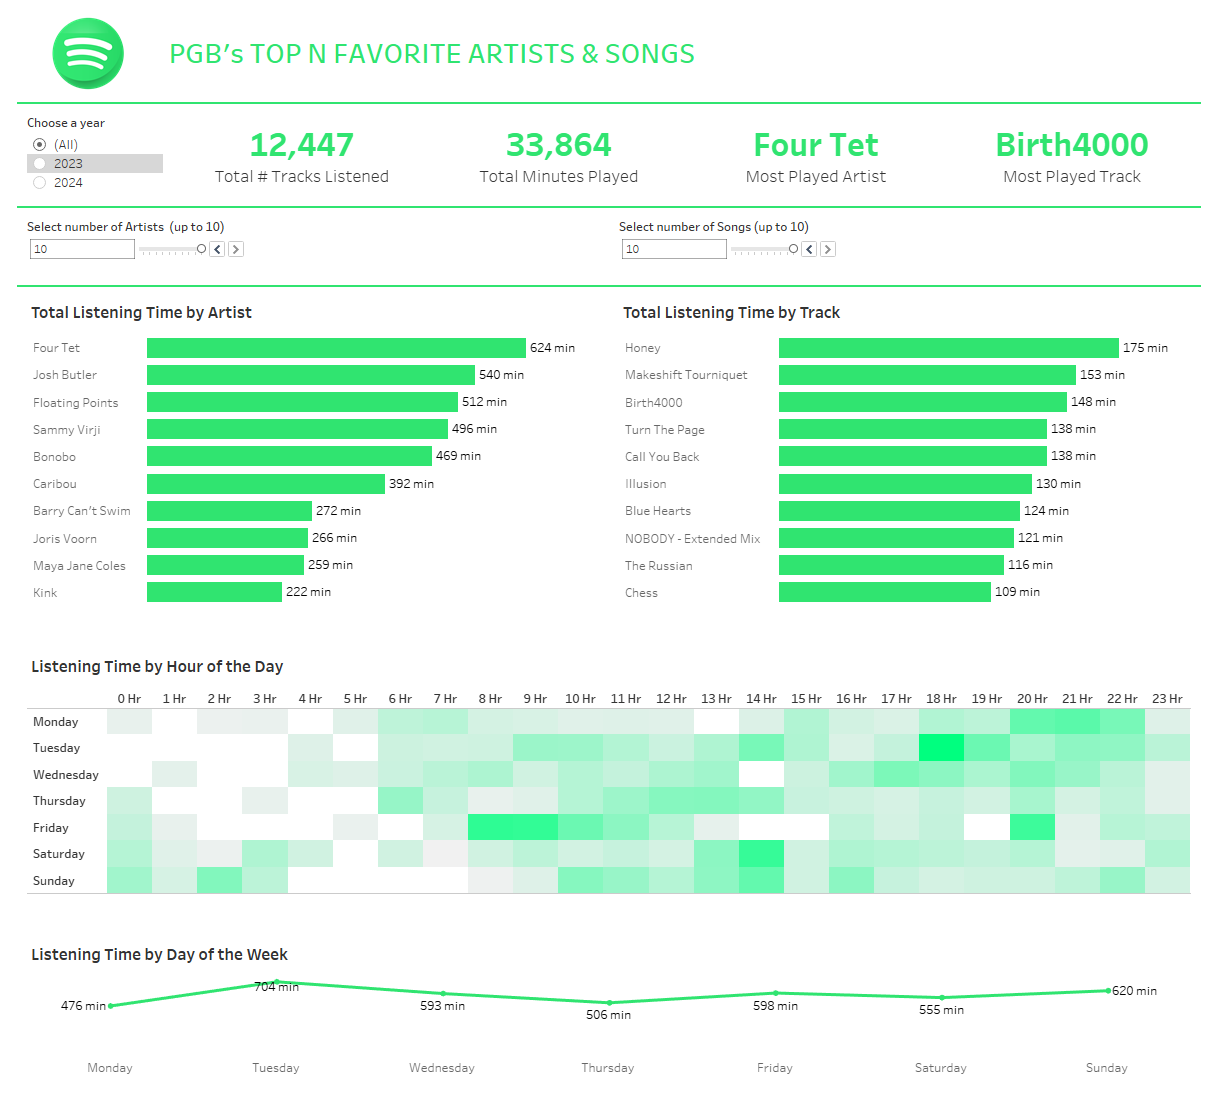
KPIs: Quick Stats at a Glance
I started with some KPIs to give you a quick snapshot of your music habits. You'll see:
- Total Number of Tracks Listened: Ever wondered how many tracks you’ve listened to in a year? Now you’ll know!
- Total Minutes Played: Find out just how long you’ve spent lost in tunes.
- Most Played Artist: Who's your all-time favorite artist? The answer might surprise you (or not)!
- Most Played Track: That one song you just can't stop playing? It’s right here.
Bar Charts: Visualizing Your Favorites
I built two bar charts to break down your top music choices:
- Total Listening Time by Artist: See how your favorite artists stack up against each other.
- Total Listening Time by Track: Curious which tracks dominate your playlist? This chart will tell.
Heatmap: When Do You Listen?
The heatmap reveals your listening habits by the hour. Are you an early bird who starts the day with tunes, or a night owl who winds down with music? This visual gives you the answer.
Line Chart: Weekly Trends
How does your listening to different artists vary throughout the week? The line chart tracks your listening time by day of the week. You might find that Mondays need an extra musical boost, but Tuesdays are your peak listening days.
Filters for Deep Dive
In case you want to narrow down the insights? I’ve added some handy filters:
- Year Filter: Choose between 2023 and 2024 to see how your listening habits have evolved.
- Top N Artists and Tracks: Curious about your top 5 or top 10 artists and tracks? Adjust these filters to see the top N of your choice.
Conclusion
With this dashboard, you can uncover trends and patterns in your music listening habits. So, have a look at it, play around with the filters, and get ready for, perhaps, some surprising revelations about your music preferences.
Below, you see a snapshot of the dashboard. Click on it to explore it on Tableau Public (and don’t forget to shower it with many stars! 😊)
I very much look forward to your thoughts and insights, P. In any case, a heartfelt thank you for your guidance, patience, and always encouraging words during this time!
Cheers!