


Python, SQL, and R are the top programming languages for data scientists and analysts. These languages help clean and transform data. Depending on each case and the requirements, the user can use SQL or Python to solve problems. The syntax between those 2 languages is also different. Therefore, I plan to write a series of blogs to compare the differences in using those languages to solve the problem. For each blog, give a problem that data analysts/ scientists usually solve when transforming the data. Tableau Desktop is known as a software to explore and transform the data, and the user doesn't need to have much experience in programming to use it.
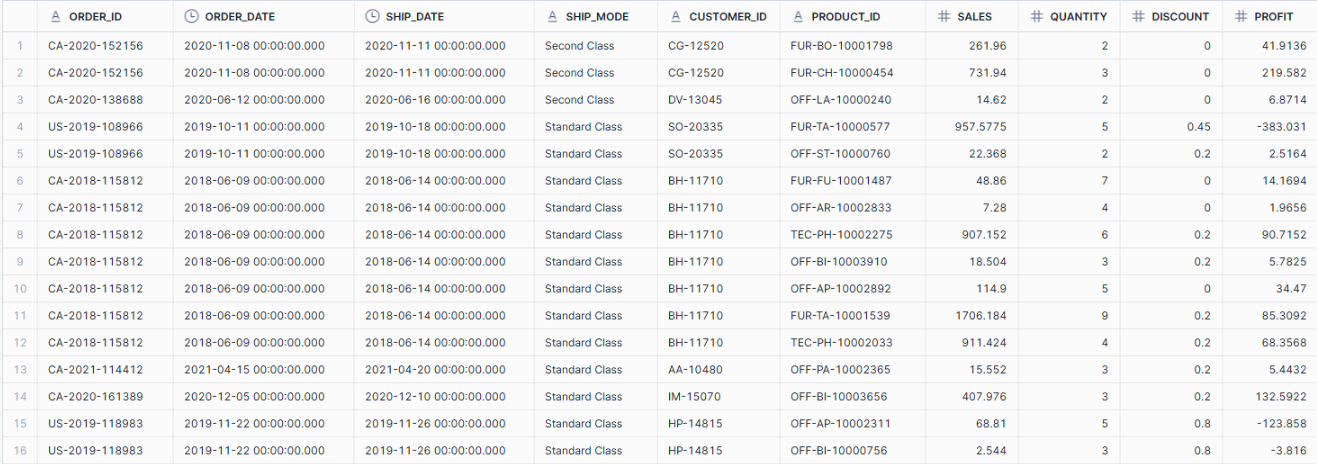
For this first blog of the series, I will share how to apply the group by function and window functions to solve the problem. At the end, I will share how to solve the problem with Tableau Desktop. The example dataset I use in this blog is from the Superstore Dataset on Tableau. You can download it by clicking here.
Problem: I want to find the lowest percentage of sales drop by month in the year 2021.
1/ GROUP BY and find the aggregation number
In SQL:
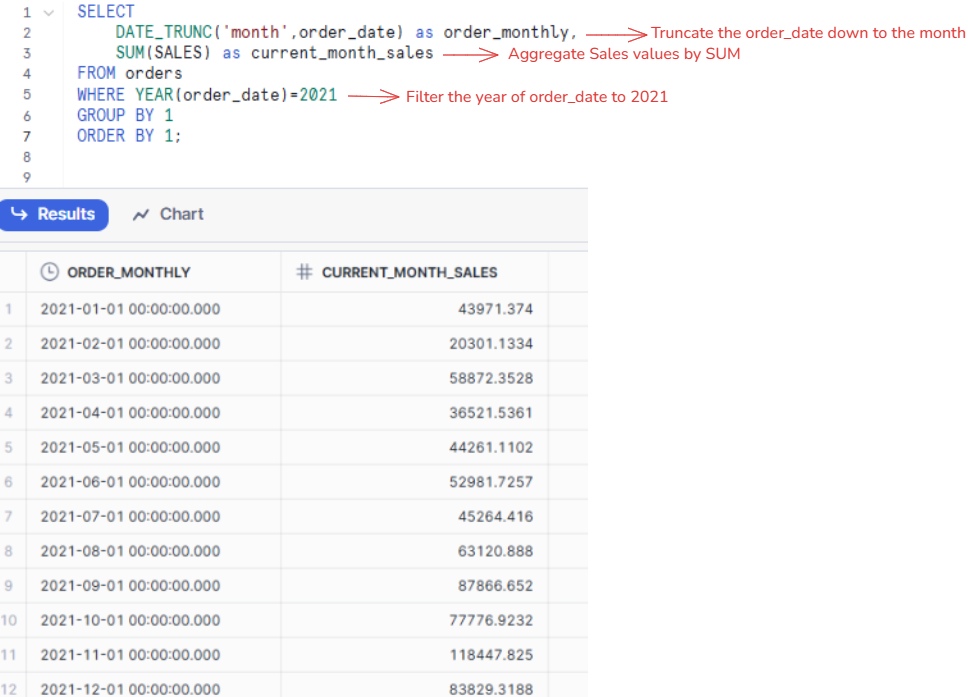
Write a SQL query to find the total sales of each month, group by the order_date and filter by the year 2021.
I used the DATE_TRUNC() function in Snowflake to truncate the order_date down to the month, so you will see the timestamp is the first day of each month in the year 2021. After I get the month in the year 2021, I need the sum of sales by each month. So, I used the aggregate function SUM() for the sales columns. As the requirement, we only need the year 2021, so I used the YEAR() function to filter only the year 2021.
At the final step, I want to find the sum of sales group by each month of the year. So, I need the GROUP BY clause to group by the monthly_sales. I also ordered the table by the monthly_sales accending.
In Python:
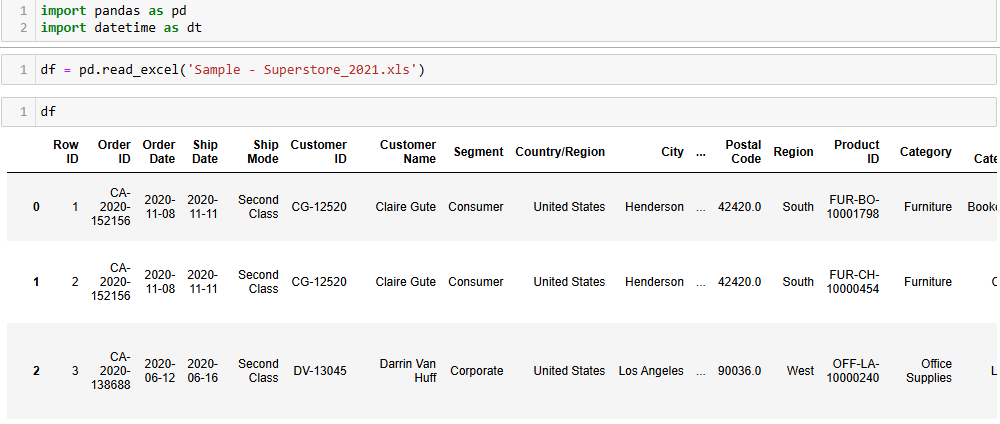
After importing the packages and inputting the data into a dataframe (Fig. 3), we can start calculating the sum of sales by each month in the year 2021.
Then, apply the groupby function and agg function in Python to find the total sales of each month.
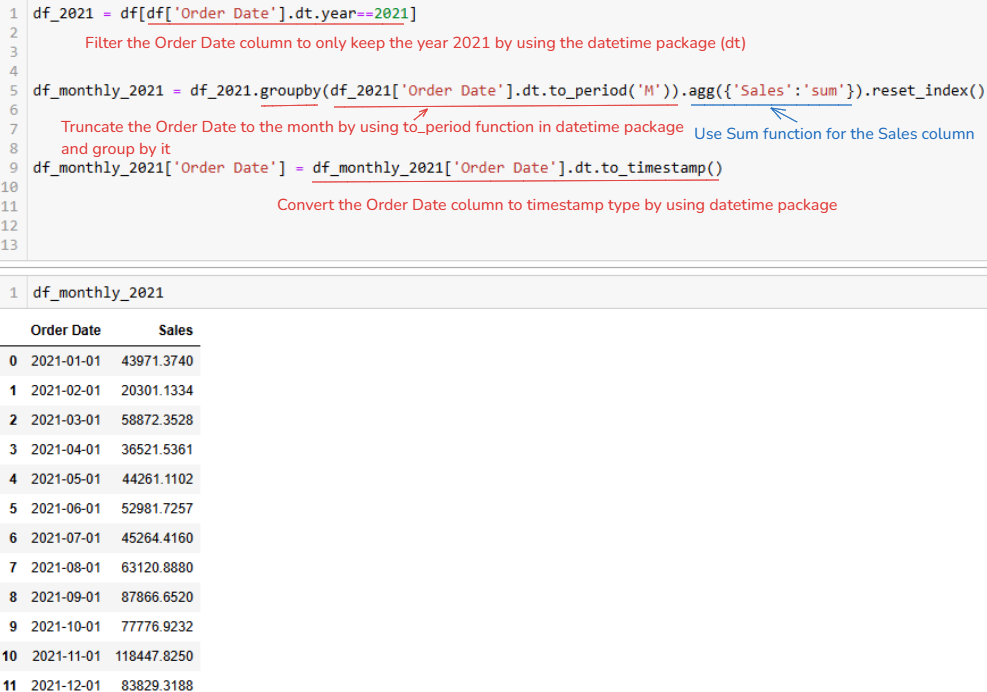
First, I filter the Order Date column to keep only the year 2021 by using the datetime package (dt) that I imported at the beginning. Then, I used the group by function to apply to the df_2021 dataframe. Inside the group by function, I need to configure the column to group by and the aggregation function for which column. After that, I used the reset_index function to keep Order Date as a column not an index column.
At the final step, I convert the Order Date column to a timestamp and print out the result.
2/ Shifting Rows to find differences by month
In SQL:
To find the value in the previous row, I will use the LAG function in Snowflake. From the SQL query above, I will put it in a CTE called total_sales_cte. Then, I write another SELECT statement to find the previous month's sales values.
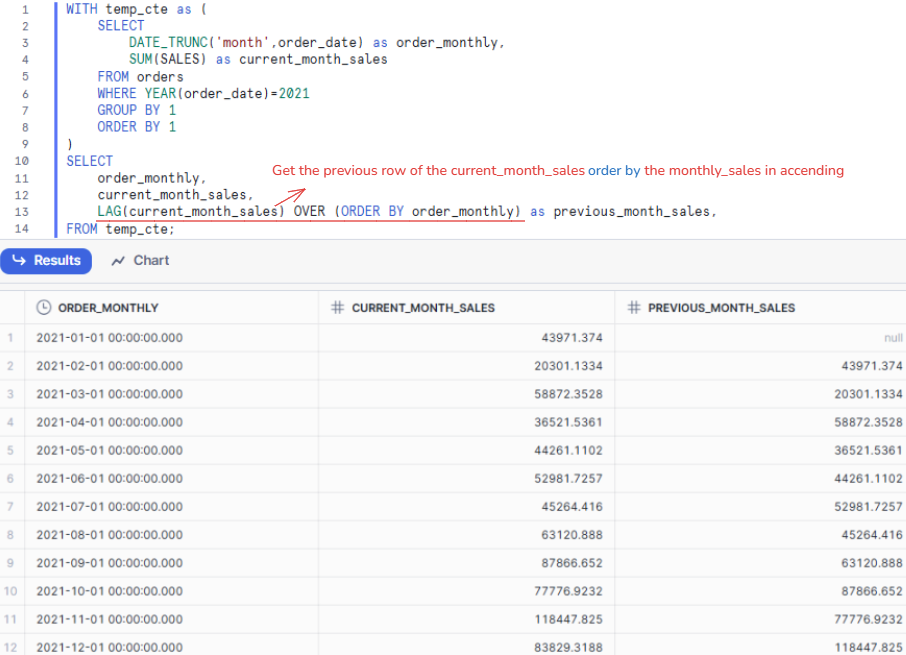
Then, I write a SELECT statement to return the order_monthly, current_month_sales and apply the LAG function to the current_month_sales value order by the order_monthly. So, it will order the order_monthly column and return the current_month_sales value in the previous row (Fig. 5). If you haven't used the LAG function before, you can read the documentation here.
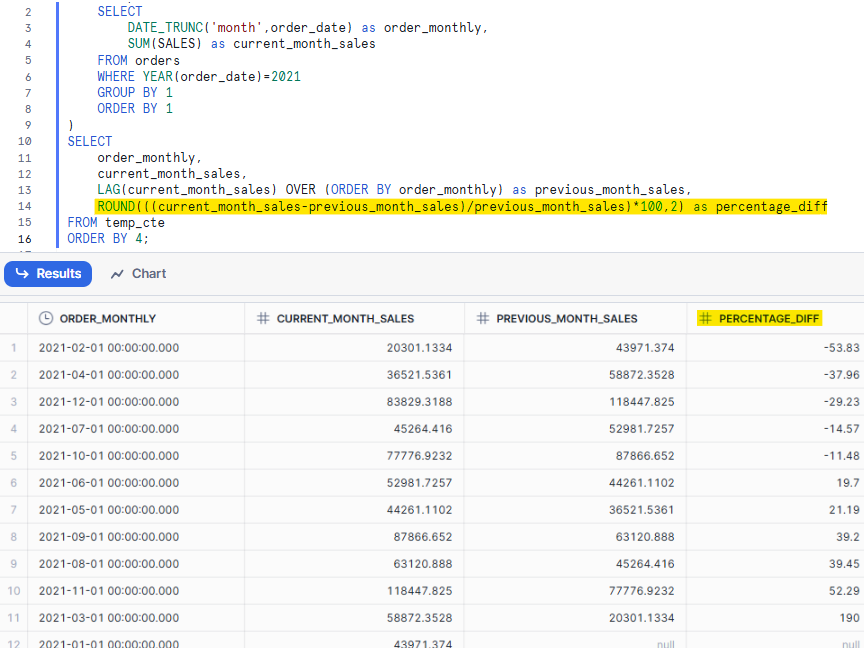
In the final step, I added another calculation to find the percentage difference in sales between the current month and the previous month.
In Python:
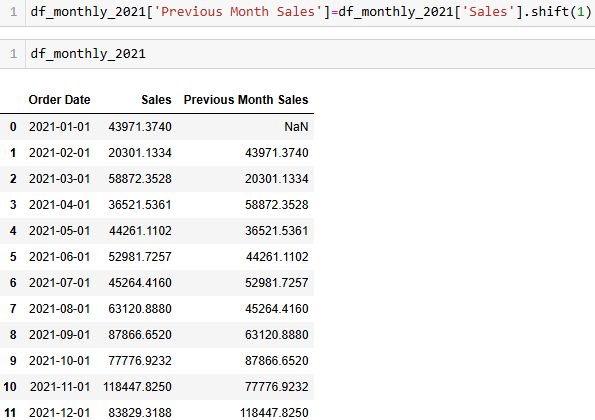
After I calculated the total sales for each month in the year 2021, I started to get the sales value for the previous month. Note that the Order Date column should be in ascending order. I created a new column in the dataframe df_monthly_2021 called "Previous Month Sales". Then, use the shift function with value 1 to shift 1 row down (Fig. 7).
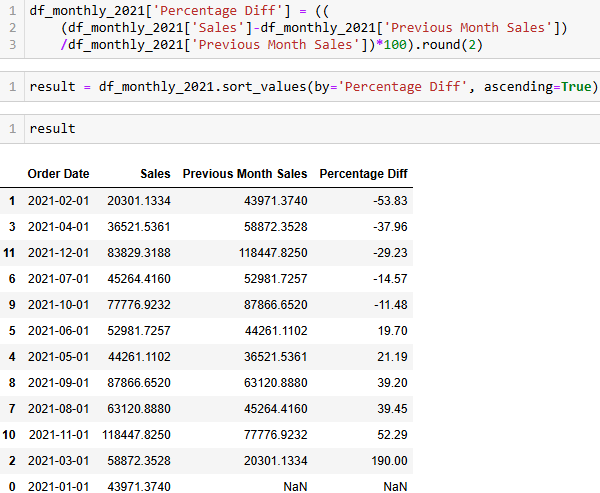
From that, I can calculate the percentage difference in sales between the current month and the previous month and order by the percentage diff in ascending.
3/ In Tableau Desktop
After working with SQL and Python, you need to write the code. How about without using any code to get the result? Let's try it with Tableau!
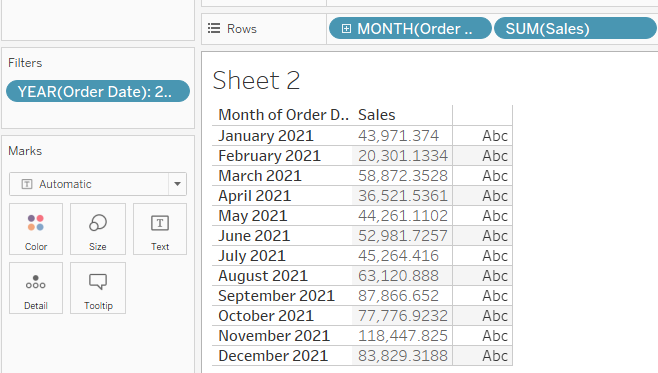
Open Tableau and connect to the superstore dataset, then filter the year of the order date to 2021. Then drag the Order Date (Choose Discrete Month) and Sales fields into Rows (Change them all to Discrete).
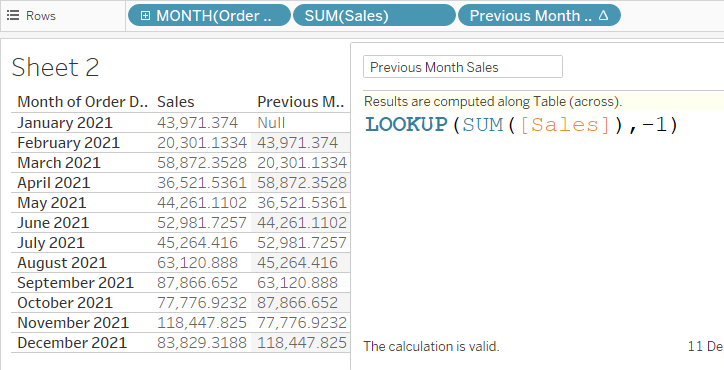
Now, to find the previous month sales values, I create a new calculated field and use the LOOKUP function. For the expression, I put SUM([Sales]). For the offset, I put -1 because I want to get the previous row (Fig. 10).
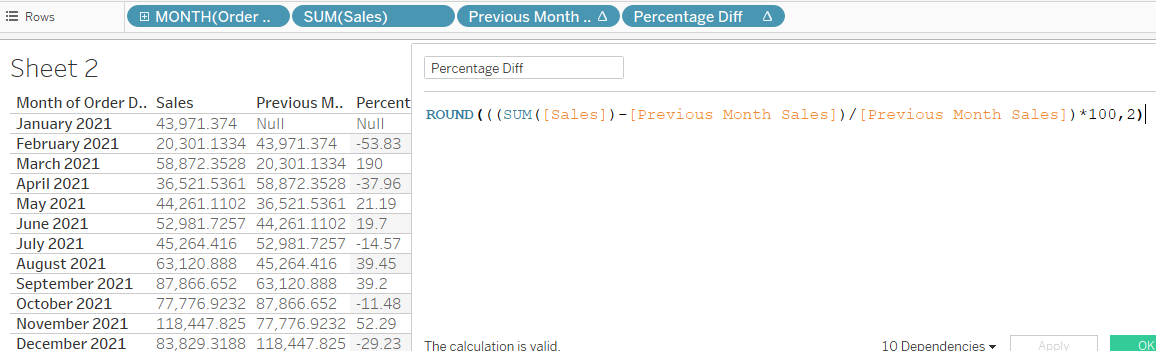
To find the percentage diff, I created a new calculated field with the same logic as I did in SQL and Python (Fig .11).
Now, the problem is you cannot sort the table by Percentage Diff because the calculation in Previous Month Sales is a table calculation. Valerija (Coach at The Data School New York) shared a tip to sort it.
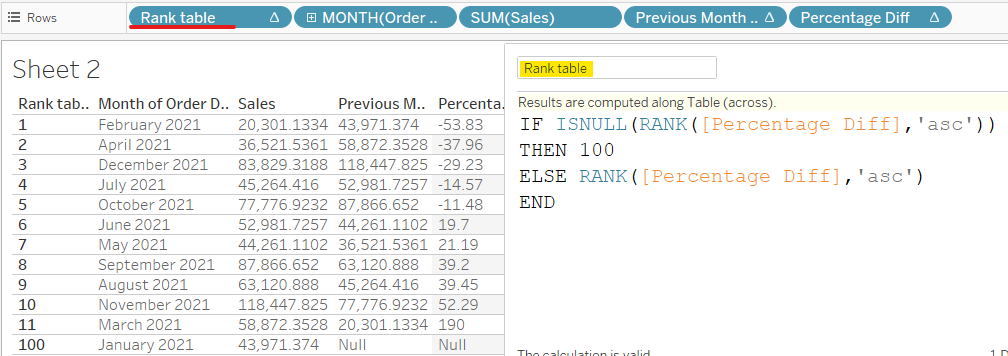
Create a new calculated field called "Rank Table". For this calculation, I need to catch the Percentage Diff value is Null. If it's null, I will move that value to the end of the table, so put a random large number (For example, I put 100 as I know only 12 rows limit). Otherwise, rank the Percentage Diff in ascending order. I dragged this calculation to Rows and changed it to Discrete. This field will automatically order from the small rank to the large rank (Fig. 12). You can also hide this field to match the table as we did in SQL and Python.
SQL and Python are two popular languages that most data scientists, data analysts and data engineers are using now. Depending on the requirement, the user can choose to use SQL or Python. Those languages are useful to transform the data; especially for the complex problems. However, it could be a challenge for those who don't have a programming background.
I hope this blog can help you to compare how to solve the problem in SQL, Python. Tableau Desktop is a powerful tool to visualize the data. Besides that, you can also explore and transform the data directly on Tableau Desktop. With Tableau Desktop, you don't need to write and memorize the programming language to use. In the new Tableau version 2025.1, Tableau introduced a new feature called VizQL. It's also helpful to transform the data without using BI tools and it's also called Headless BI. I will write about how to use it in the next blog!
Hope to see you soon!