


I wrote 2 blogs about Spatial Analytics in Alteryx. The Spatial tools in Alteryx helped me very much when I was working with Spatial data. If you haven't read it, you can read it here. In Tableau, some Spatial functions also help to prepare the data and directly work on the Spatial data before building the visualization. In this blog, I am going to share some Spatial functions in Tableau and build the visualizations with those Spatial data.
The data I use in this blog is from the Work Out Wednesday 2022 - Week 13 challenge. The data is about U.S. flight Routes. The dataset includes the Origin Name, Origin Longitude, Origin Latitude, Destination Name, Destination Longitude and Destination Latitude, ... In this blog, I am going to walk through:
1/ Spatial Object types in Tableau
2/ Create Spatial Objects
3/ Find the distance between points
4/ Find the area of Polygon Objects
1/ Spatial Object types in Tableau
As same as Spatial Object in Alteryx, there are 3 main Spatial Object types in Tableau. They are Point, Line, and Polygon Objects.
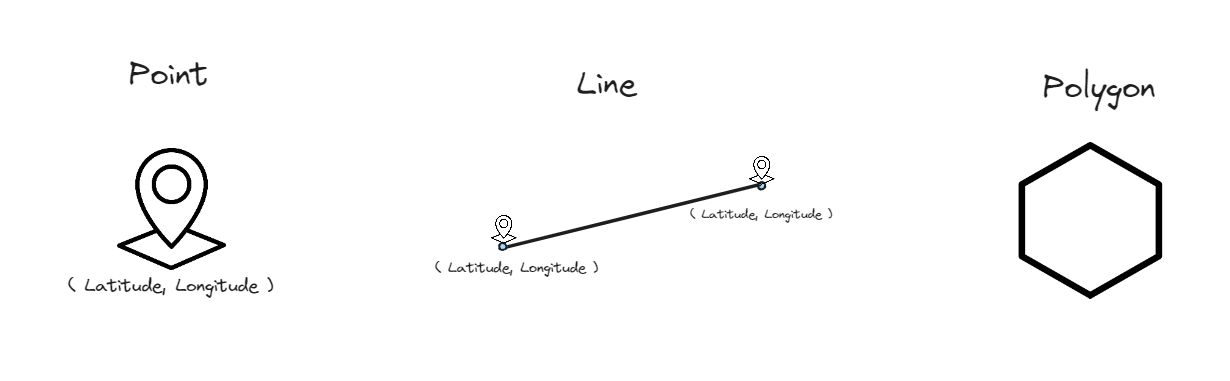
Point Object: it requires the Latitude and the Longitude values. Both Latitude and Longitude values are measured in degree units; for smaller units, it would be in minutes (') and seconds ("). Latitude and longitude values are in decimal formatting with a positive and negative sign.
Line Object: it requires 2 Point Objects to create a Line. It will connect the origin point to the destination point.
Polygon Object: a set of multiple points and they are connecting to create a loop.
2/ Create Spatial Objects in Tableau
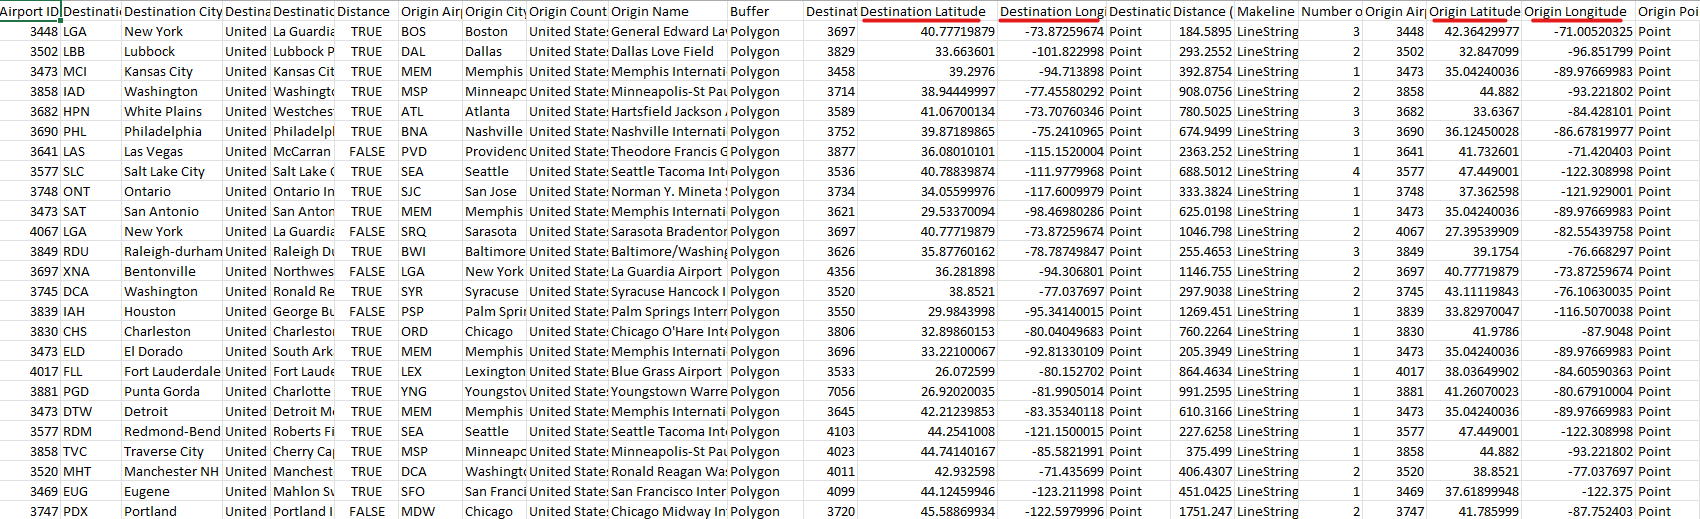
After downloading the data from the Work Out Wednesday 2022 - Week 13 challenge, I got the origin latitude and longitude and the destination latitude and longitude in the dataset (Image 1). Then, I import the dataset into Tableau.
- Create Point Objects:
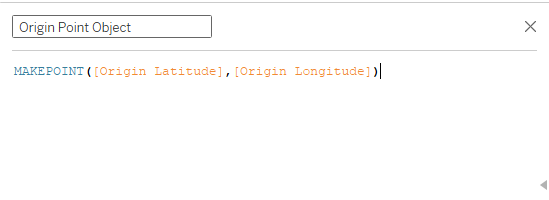
In Tableau, there is a function called MAKEPOINT( [Latitude], [Longitude]) to create a Point Object. In the dataset, there are Origin Latitude and Origin Longitude, so I only need to create a calculated field called Origin Point Object. Then, plug in those coordinates into the MAKEPOINT() function (Image 2).
After I click on the Apply button and OK button, Tableau automatically knows that the calculated field is a Spatial type. There is a globe in front of the Origin Point Object title. If I double-click on that pill, Tableau automatically shows all the Point Objects on the map with the Latitude and Longitude on Rows and Columns (Image 3).
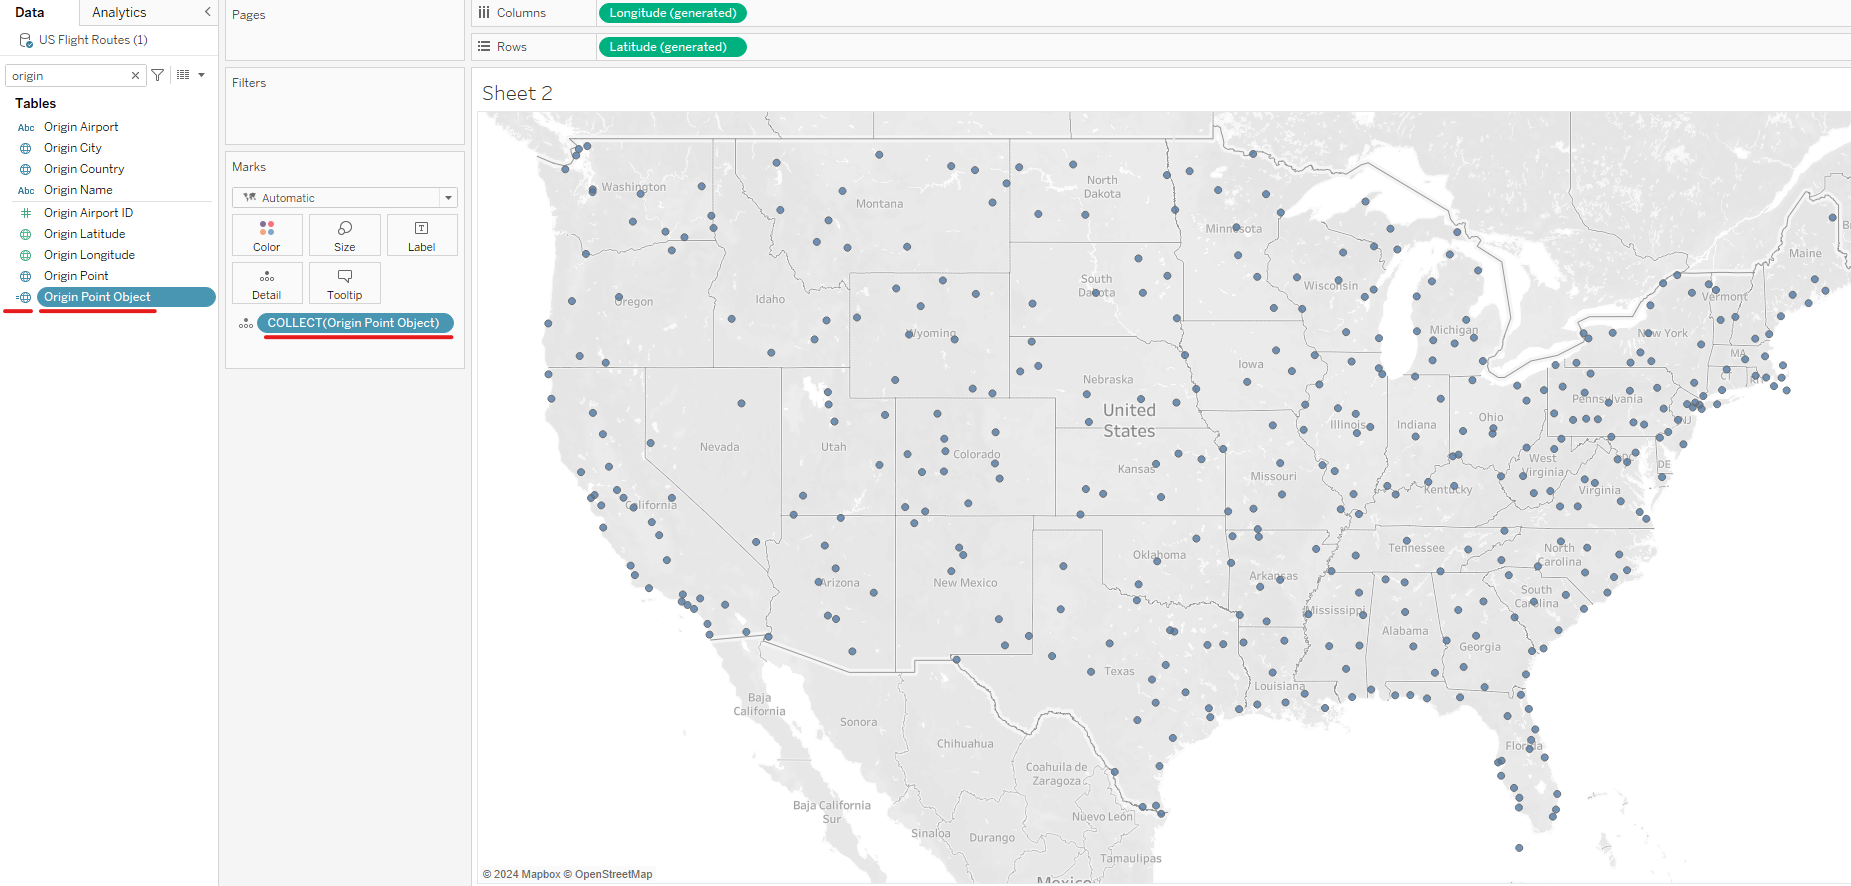
I do the same steps for the Destination Point Object.
- Create Line Objects:
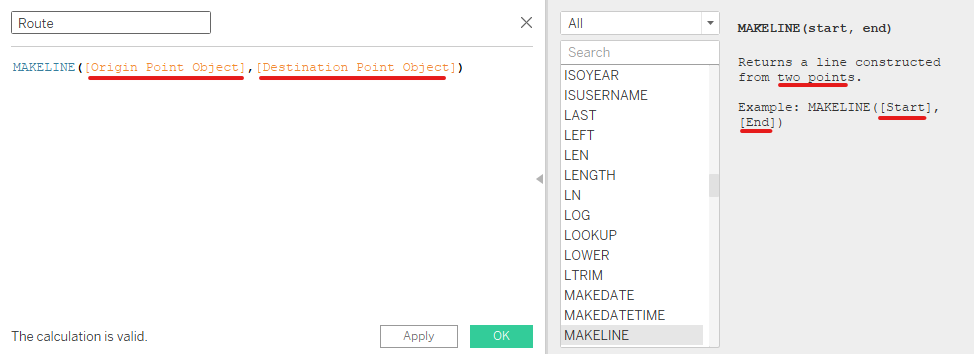
To create a Line Object, we need 2 Point Objects. I want to create a route from the Origin point to the Destination point, so I used the MAKELINE ( [start], [end]) function (Image 4).
After I click on the Apply and OK buttons, Tableau also understands that the calculated field is a Spatial field. It changes the data type to Spatial as you can see there is a globe in front of the Route field. Then, I double-click on the Route field to show on the map. Now, all Line Objects will show on the map. However, if you hover over the line, it will show everything in 1 Object (Image 5).
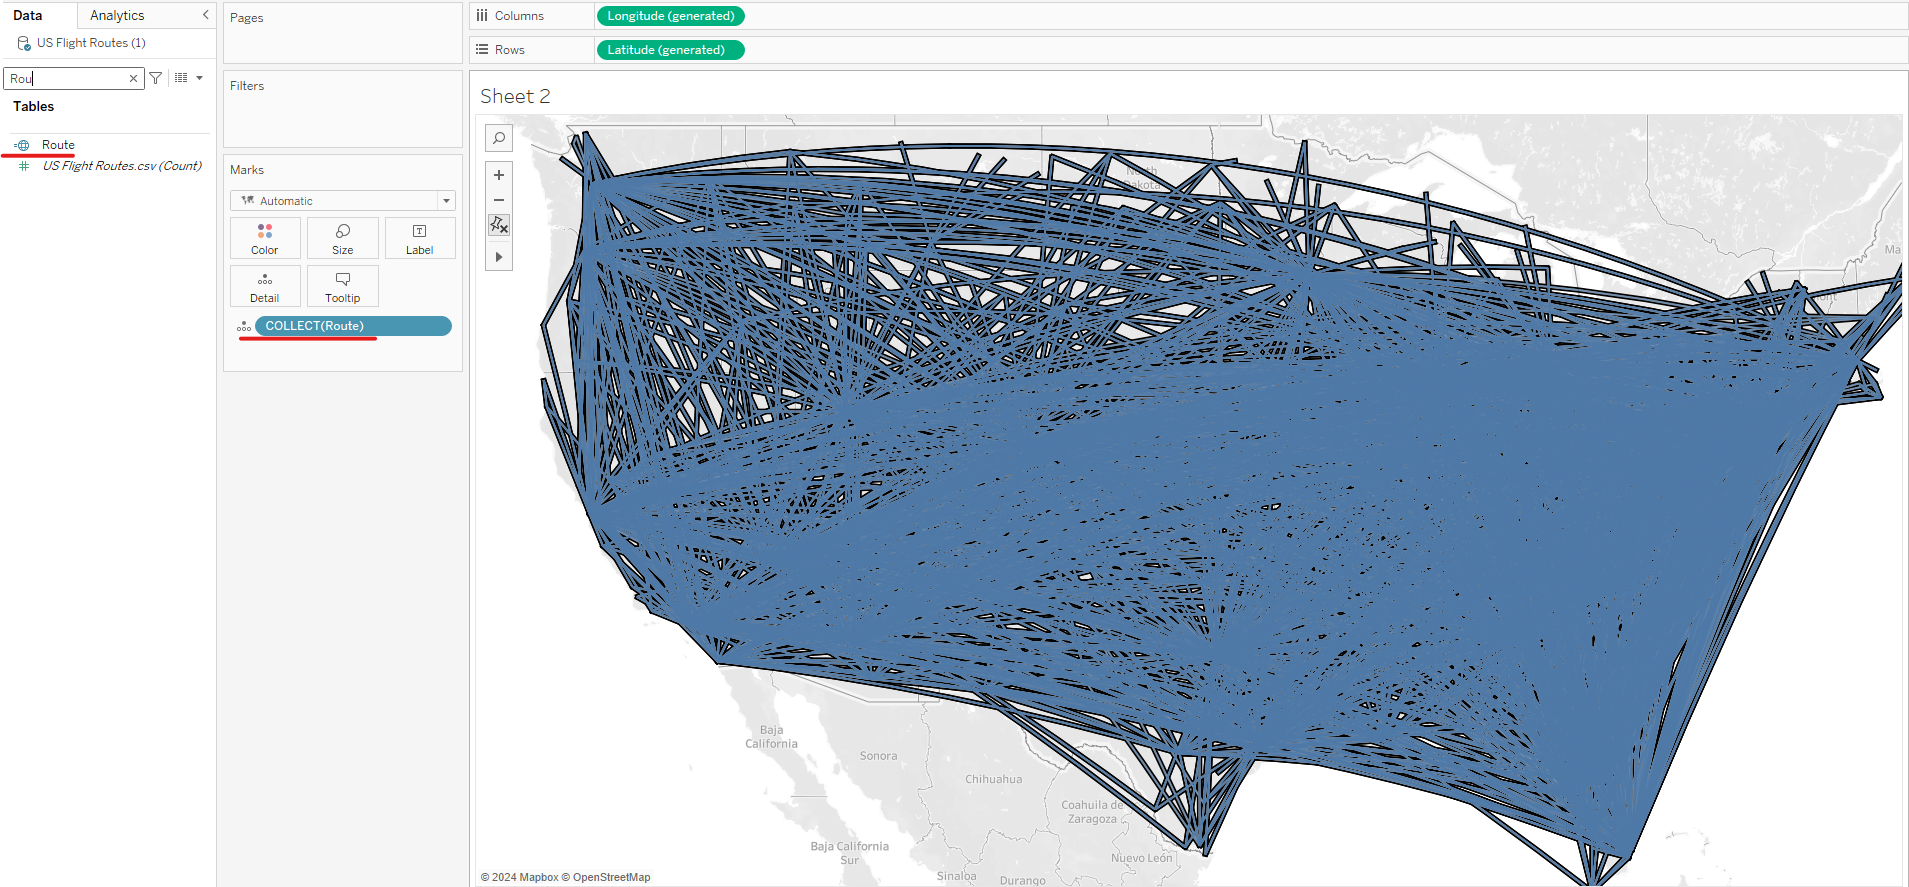
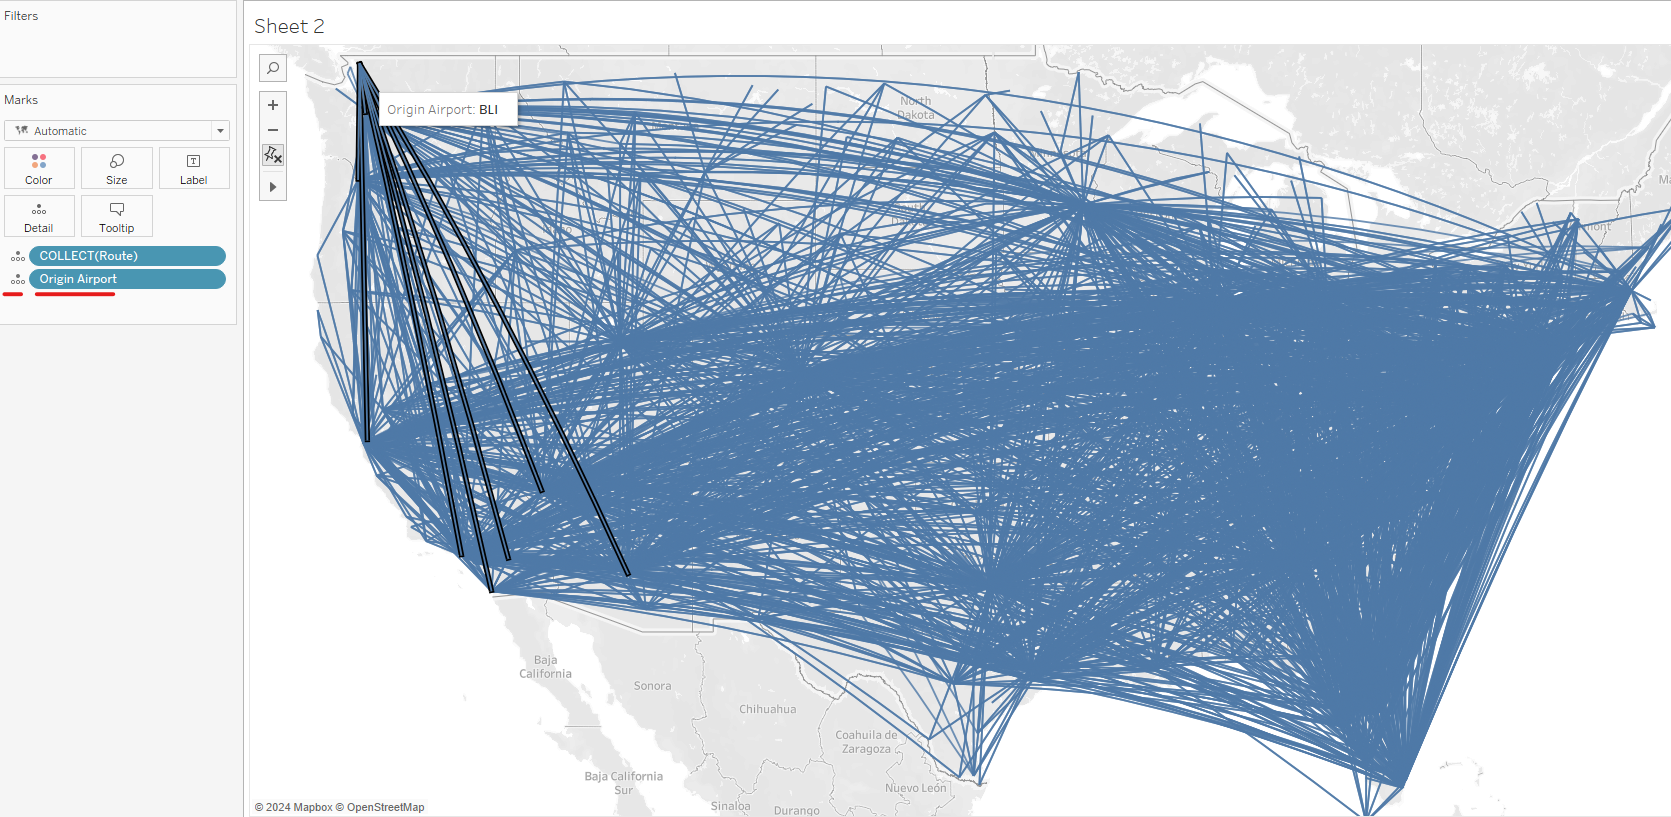
To separate each line, I will drag the Origin Airport field into Details. Now the Line Object will be separated by the Origin Airport. If I hover over any lines, it will show all the lines from that Origin Airport (Image 6).
- Create Polygon Objects:
A Polygon Object is created from a set of Point Objects and all points connect to create a loop/ area. There is no function to create Polygon Objects in Tableau. However, you can show the Polygon Object on the map.
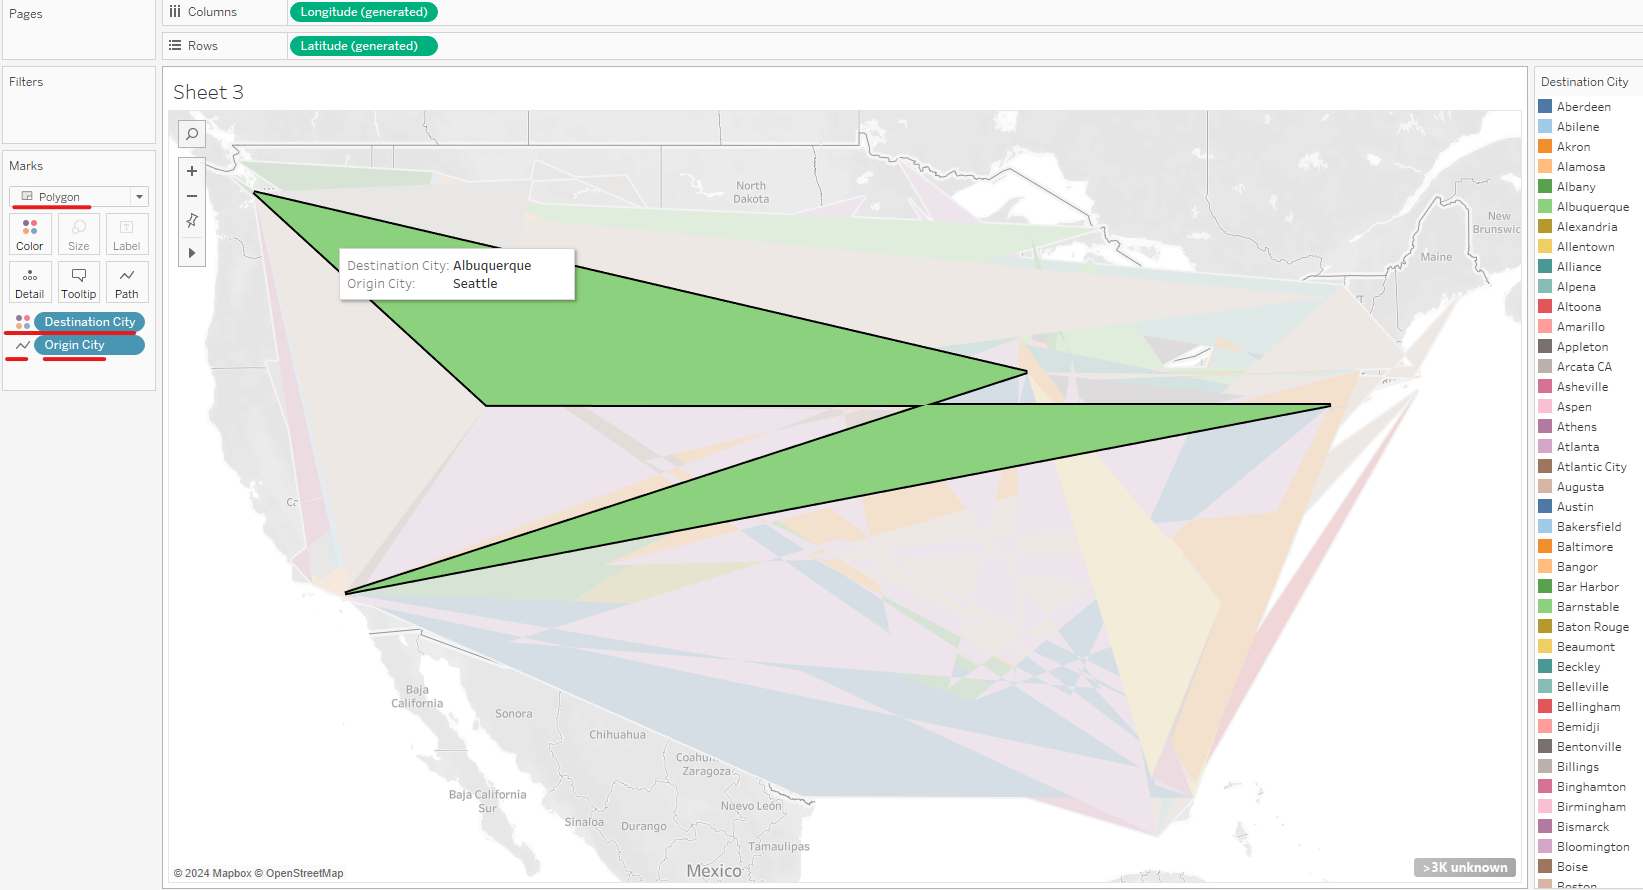
The dataset includes the Origin and Destination data. I switch the Marks type to Polygon. Then, I drag Origin City to Path and Destination City to Color. It means that all Origin City Point Objects created a Polygon which is grouped by the Destination City. Each Polygon color represents a Destination city including all Origin City to that Destination city (Image 7).
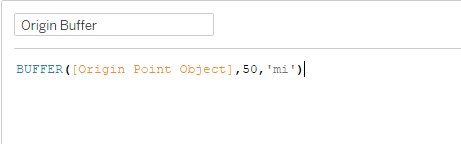
There is one function that creates the Polygon type is BUFFER. That function is the same as the Trade Area tool in Alteryx. BUFFER function will create a boundary around the Point Object with a specified distance in miles (mi), kilometers (km), meters (m), and feet (ft). The syntax is BUFFER( [Point Object], distance, 'units') (Image 8). I created an Origin Buffer field with the Origin Point Object with 50 miles distance.
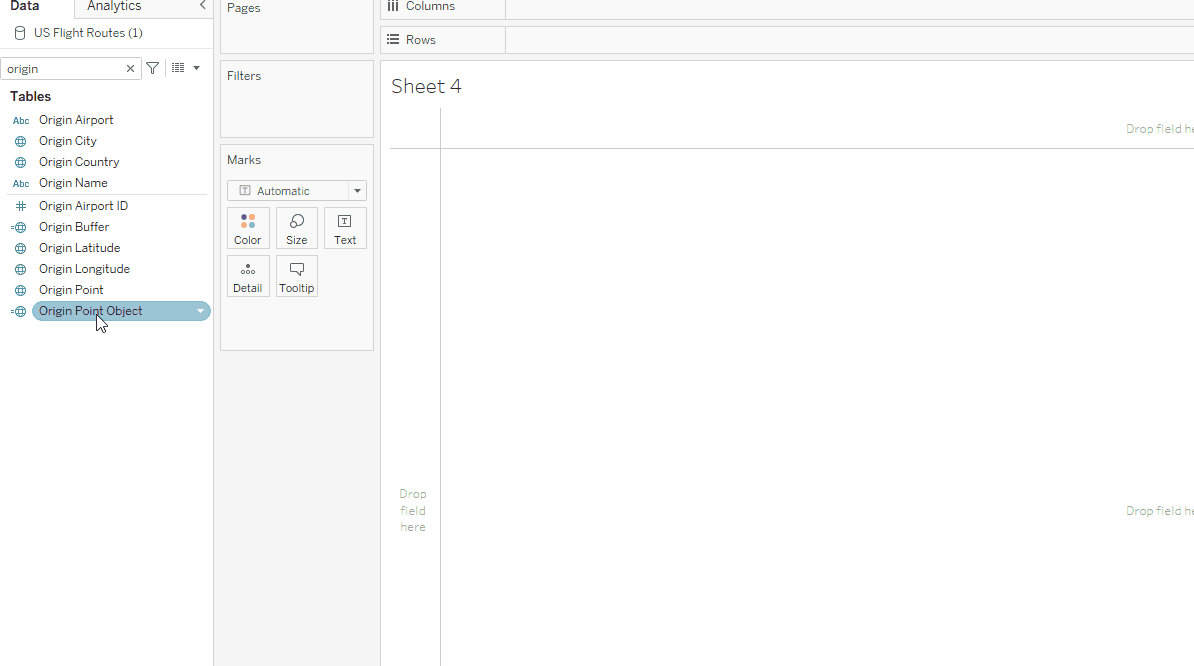
I double-click on the Origin Point Object to show on the map. Then, I drag the Origin Buffer to the map by Adding a Mark Layer. Now, the map will show the boundary around the Point Object (Image 9).
3/ Find the distance between points
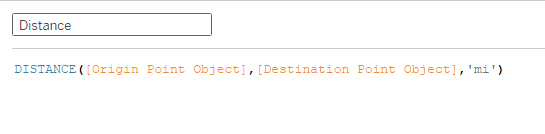
In Tableau, I use the DISTANCE function to calculate the distance between 2 Point Objects. The syntax is DISTANCE( [start point], [end point], 'unit' ). I want to find the distance from the Origin Point to the Destination Point (Image 10).
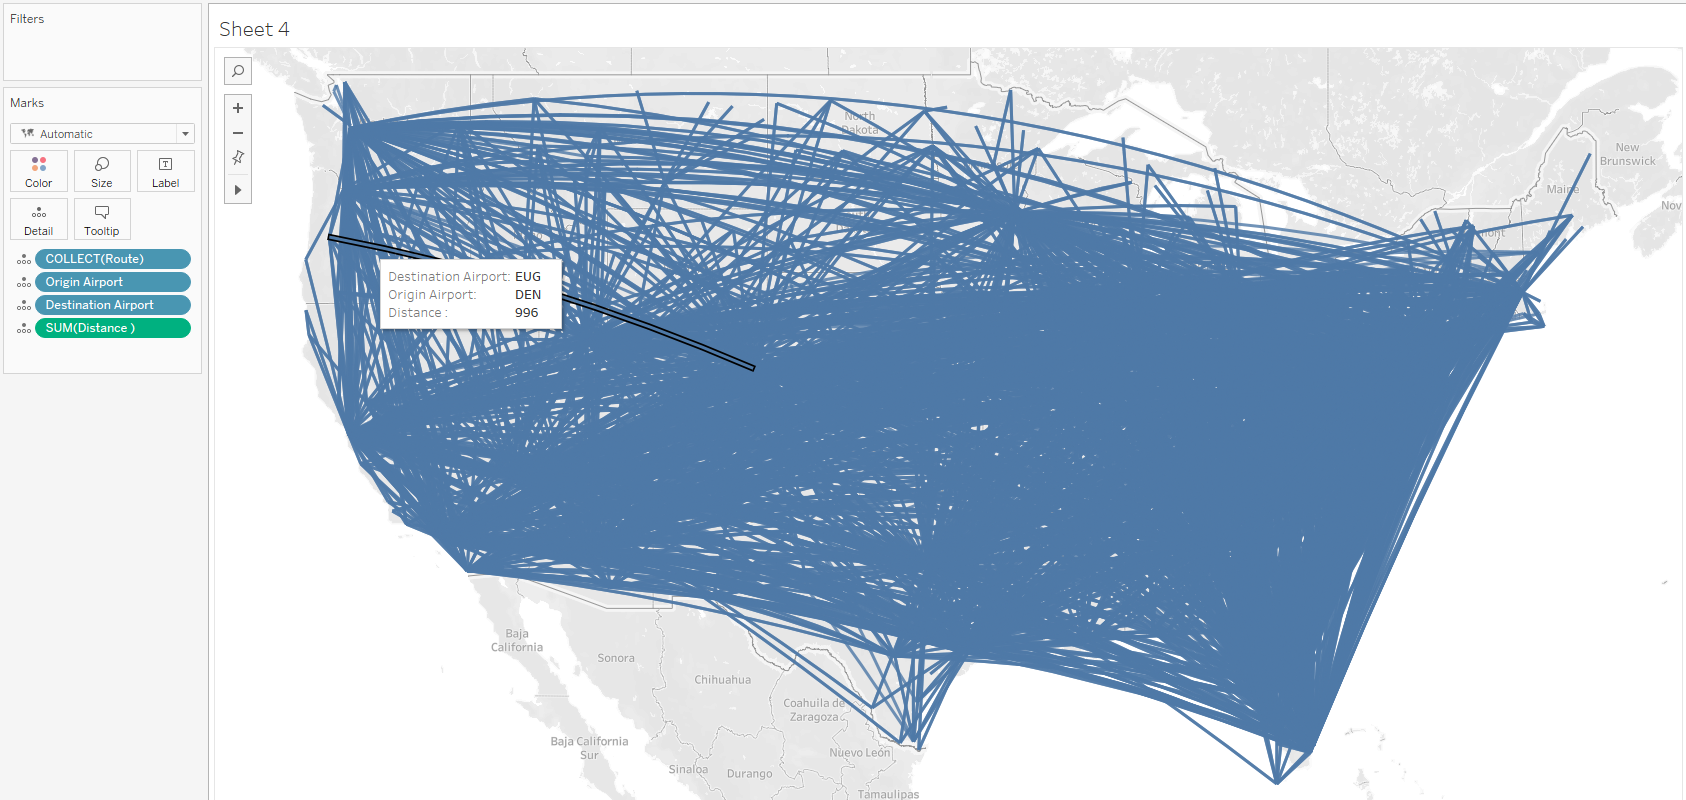
Then I double-click on the Route pill to show the route on the map. Then, I drag Origin Airport, Destination Airport, and Distance into Detail in the Marks window. Now, when I hover over one route on the map, it will show me the Origin Airport, Destination Airport, and the distance between those 2 points (Image 11).
4/ Finding the area of a Polygon or MultiPolygon
In Tableau, we can find the area of a Polygon by using the AREA function. Note that, we can only apply for Polygon objects. To do that, I use the dataset from the U.S. National Weather Service at https://www.weather.gov/gis/USStates.
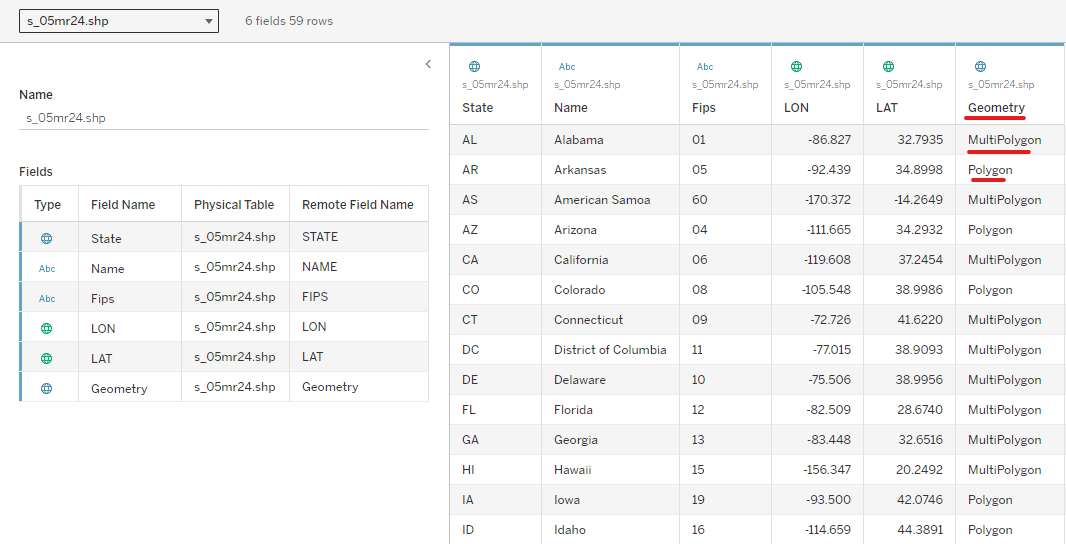
After downloading the dataset and importing the Spatial file (.shp) into Tableau, I recognized that the dataset includes Polygon and MultiPolygon in the Geometry field (Image 12).
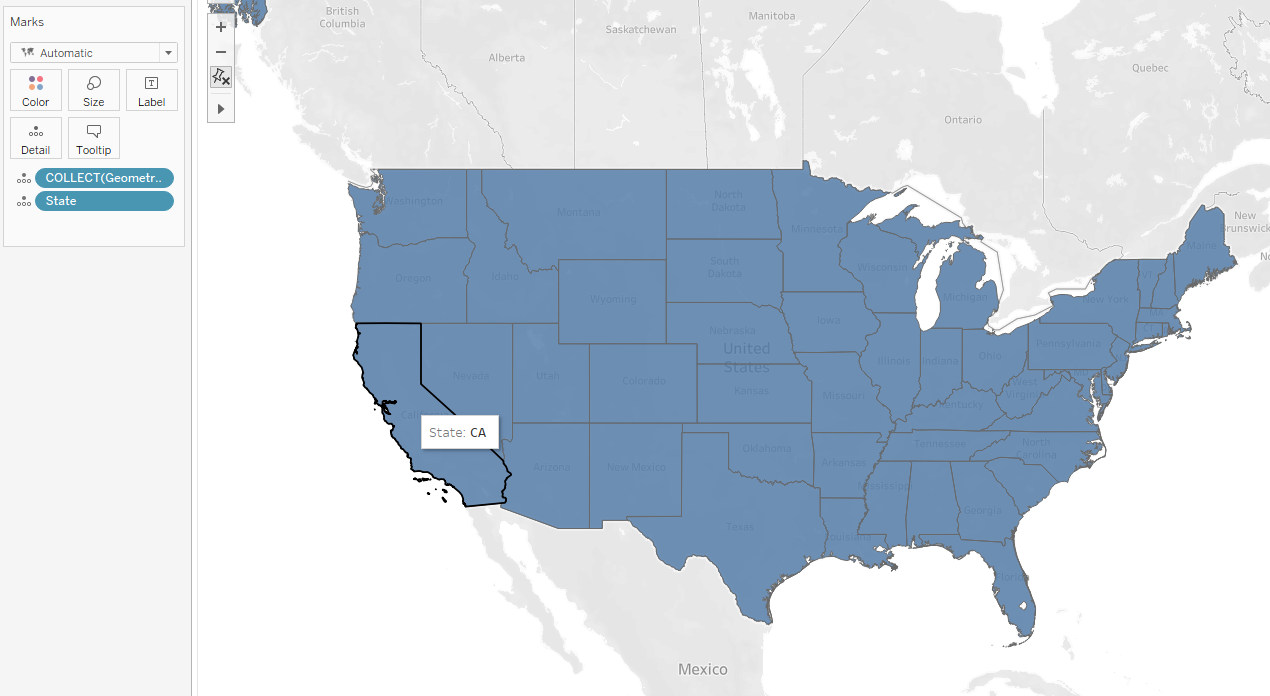
Then, I double-click on the Geometry field to show all states on the map. I also drag the State field into Detail, so now I can hover over each separate state (Image 13).
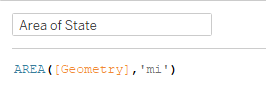
I created a new calculated field called Area of State. I want to calculate the field for each state, so I use the AREA function with the syntax AREA( [Polygon Object], 'unit'). In this case, my Polygon Object is the Geometry field (Image 14).
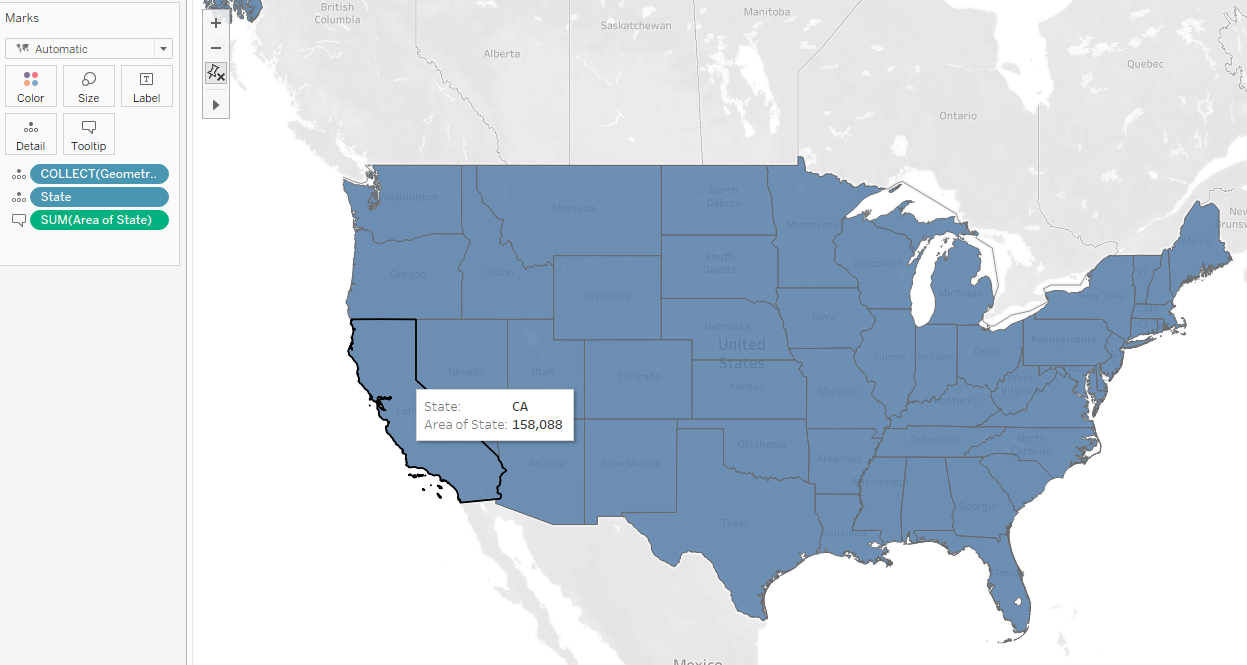
I also drag the Area of State field into the tooltip. Now, when I hover over each state, it will show me the State abbreviation and its area (Image 15).
Spatial Objects do not only apply to the map, but they also apply to images. Some creative dashboards were made from Point and Polygon Objects.
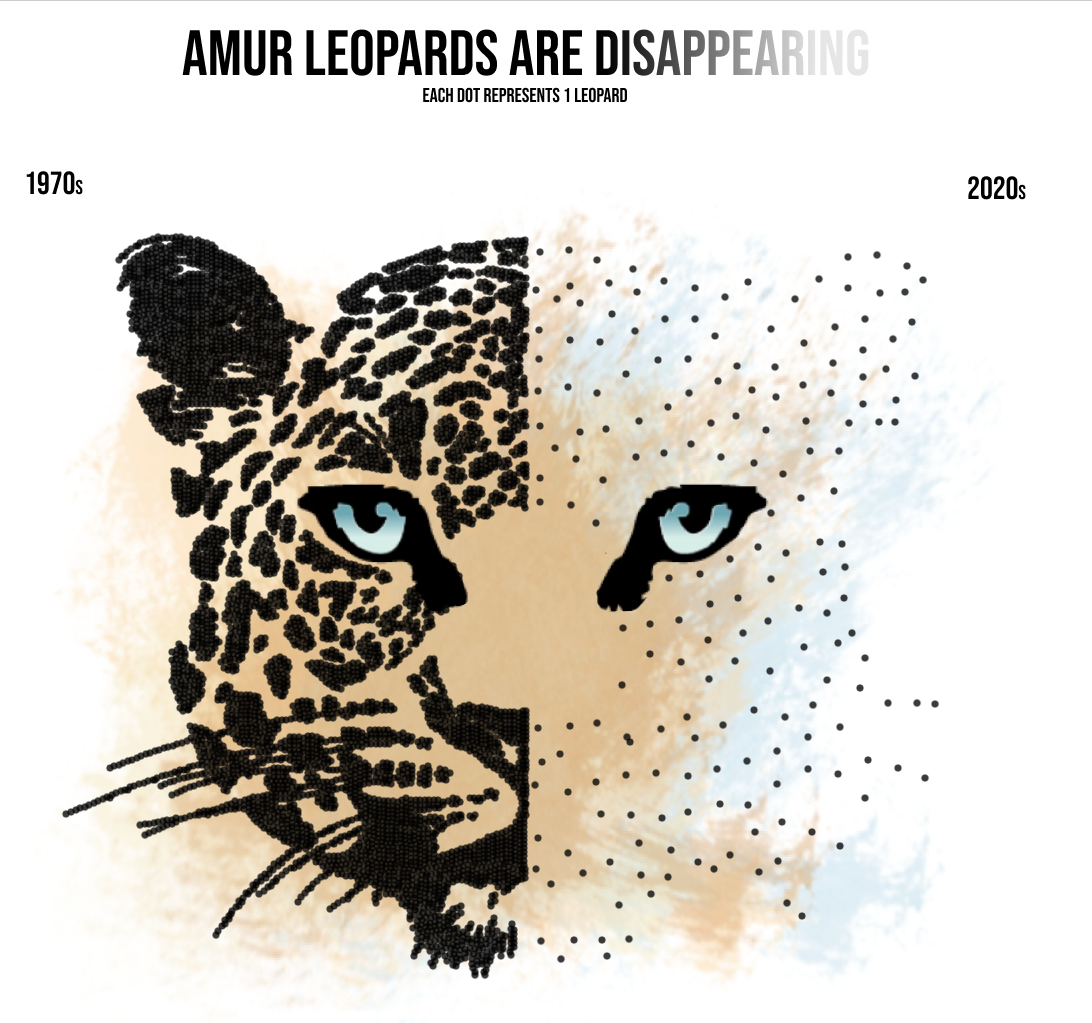
1/ Amur Leopards are Disappearing by Asha Daniels
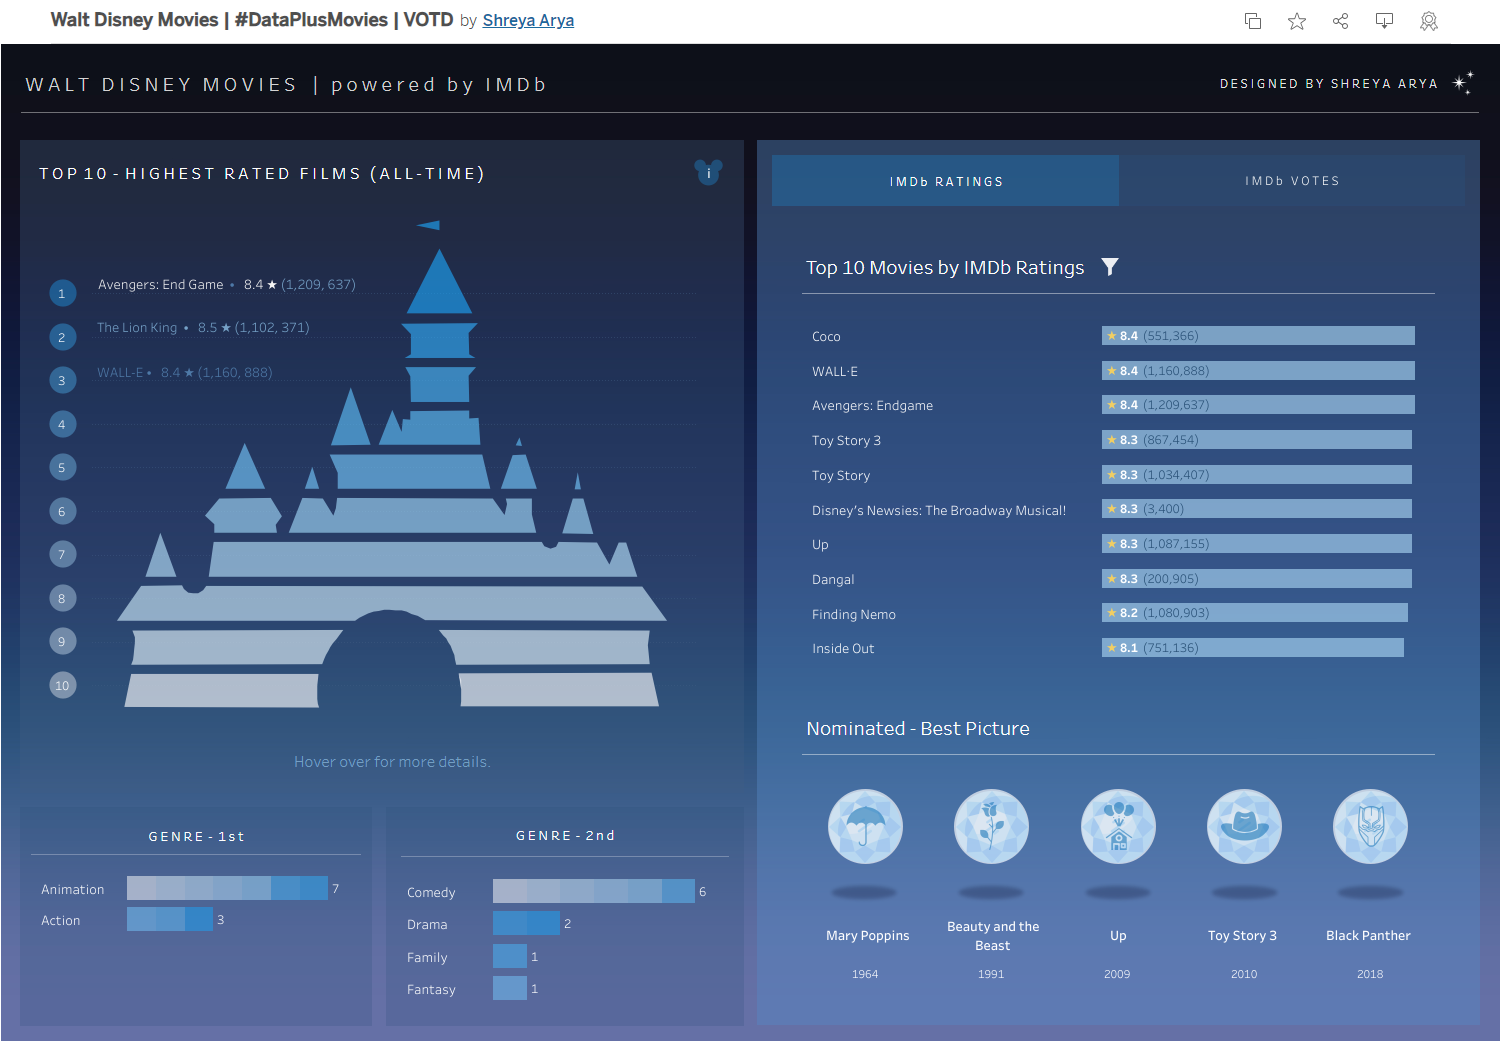
2/ Walt Disney Movies | #DataPlusMovies | VOTD by Shreya Arya
In this blog, I showed the main Spatial Objects in Tableau and the way to create those Spatial Objects. Tableau also provides some functions to calculate the distance between 2 points (DISTANCE function) and the area of a polygon (AREA function). Spatial Objects are being applied in many dashboards. You can find many creative dashboards on Viz of the Day on Tableau that were made from Points or Polygon.
I hope this blog is helpful to you. Hope to see you soon in the next blog!