


In the previous blog, I shared how to install, and load R packages in the R Console. To run the R script in Tableau Prep Builder and Tableau Desktop, we need to install Rserve and connect Rserve with the local host and port number on our local machine. If you haven't set up Rserve yet, you can check my previous blog here.
Continue to the previous blog, in this blog, I am going to share:
1/ Data Structure in R script to input/output data
2/ How to write the R script to return values in Tableau Desktop
If you already set up the Rserve, let's get started!
1/ Data Structure in R script to input/output data in Tableau Desktop
Data Frame in R
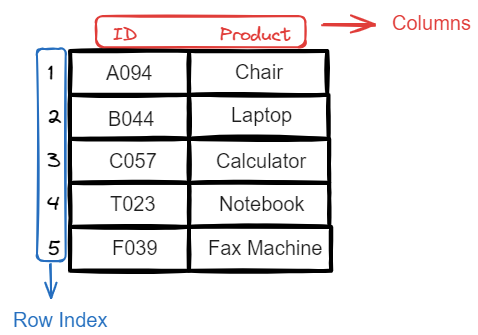
If you are working with data in Python, you might get familiar with data frame definition. In R, there is also the same data frame structure. The data frame in R contains many rows and columns. Each column will have a column name and each row will be represented by a unique row index. For example, I have a table with 2 columns (ID and Product), and 5 rows (from index 0 to 4). (Fig. 1)
In R, to create a data frame, we will use data.frame() function. In Python, each series (single column) is a list. In R, we can use a vector or list. For example, we have 2 columns (ID and product). In R, to add values to those columns, I need to use a c() vector or list() to create a list. Then, put all columns inside the data.frame() function. (Fig. 2)
Note that, the difference between c() vector and list() list is we can only add data with the same data type in c(). For list(), we can add many different data types to the same list.
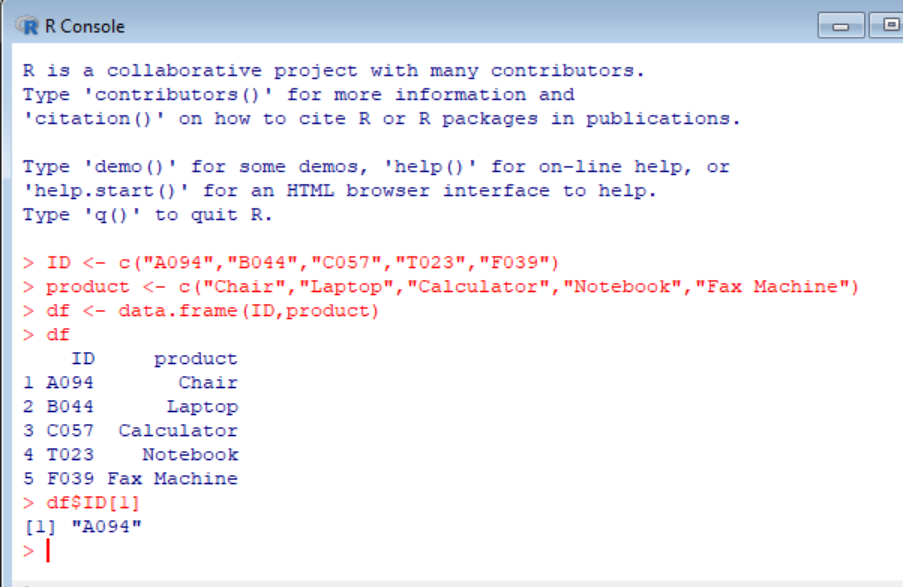
In the figure above, I have a list of string values and assign them to a variable (ID and product). Then, I created a data frame and named it "df". To access the value at a specific column and row index, I will type following this syntax: <data_frame_name>$<column_name>[row_index].
For example, I would like to get the first value in column ID. I will type: df$ID[1]. The result is shown in Fig.2.
Input/ Output data in Tableau with R
In Tableau, when we pass the data source into R, that's already a data frame. So we can use the same method above to access the values in the data frame.
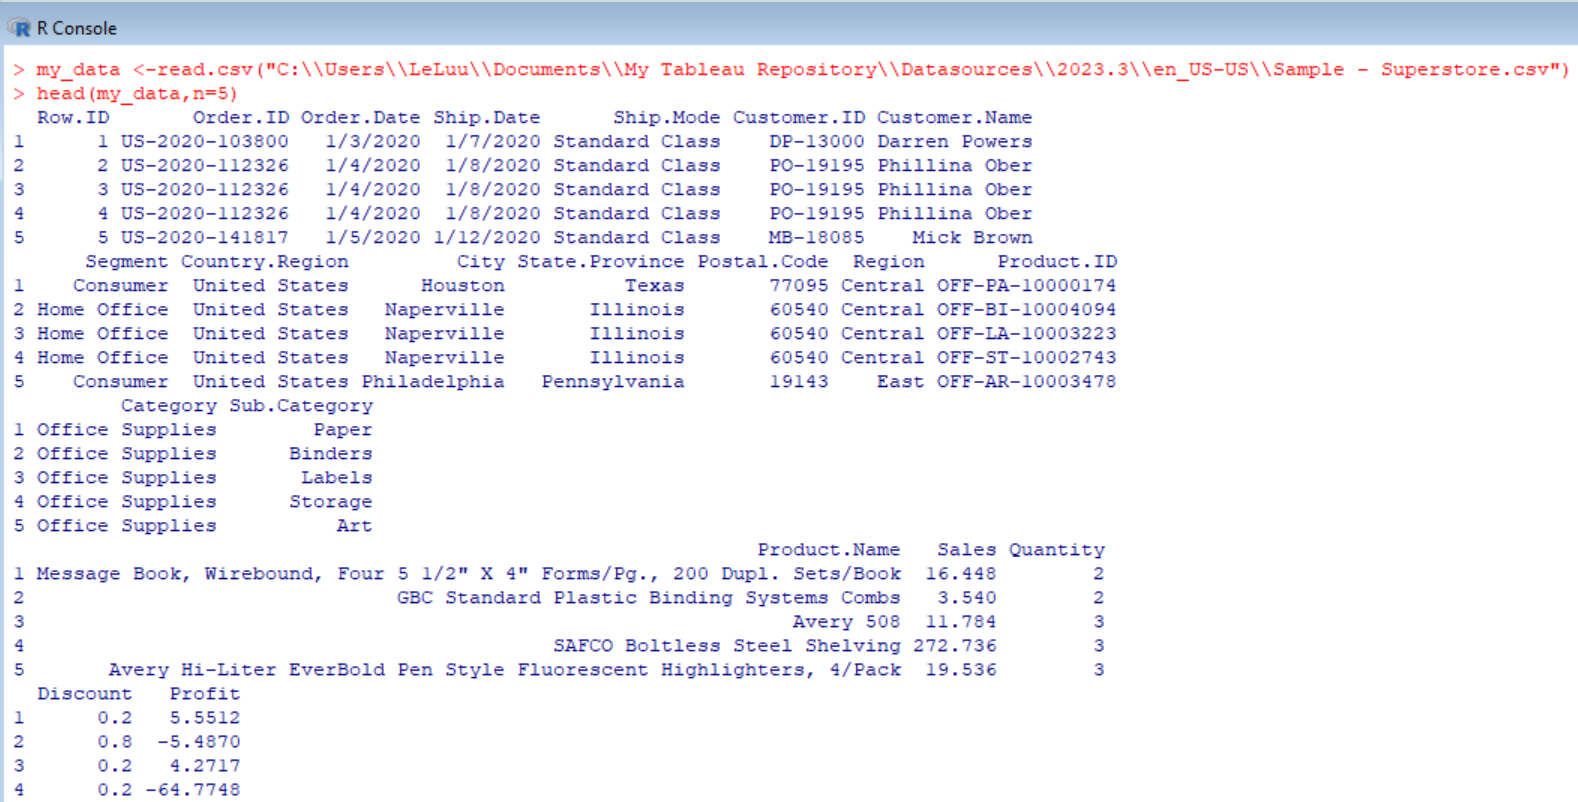
In Figure 3, I used the read.csv() function to read the CSV file and stored that data frame in the "my_data" variable. In the next line, I used the head() function to print out only the first 5 rows (index starts at 1).
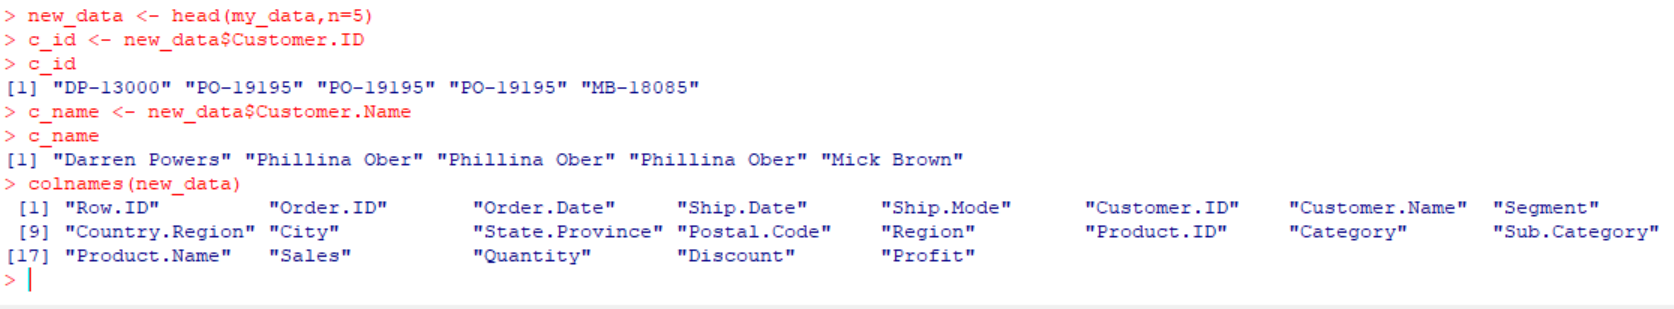
In Figure 4, I can list out all columns in the data frame by typing: colnames(<data_frame_name>). In the second line, I assigned the column Customer.ID from data frame "new_data" to another variable called "c_id". When I print out c_id, it will show the list of values in Customer.ID.
In Tableau Prep Builder, we can return a single value, a single column, or a data frame (multiple columns).
In Tableau Desktop, we can return a single value or a single column by using 4 SCRIPT functions (SCRIPT_REAL, SCRIPT_INT, SCRIPT_BOOL, SCRIPT_STR). Each Script function represented the data type of the returned value. If you would like to return a data frame with multiple columns, then you need to use Table Extension in Tableau Desktop.
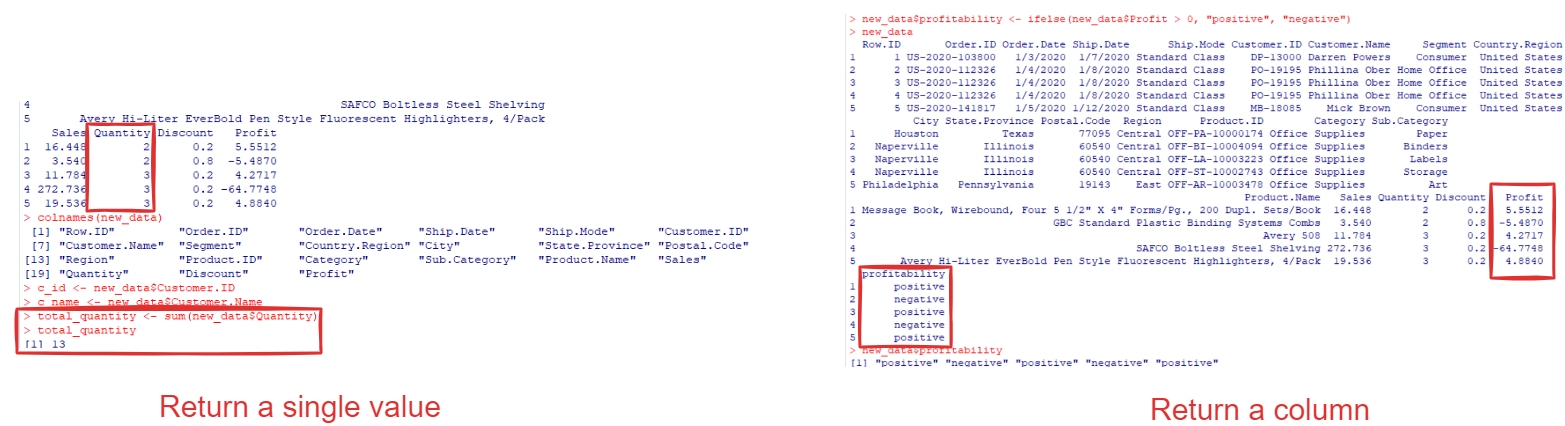
In Figure 5, on the left side is an example of returning a single value. On the right side is an example of returning a column.
Input: as you noticed in Figure 5, the input that I put in the function is a column in the data frame (new_data$Quantity or new_data$Profit). If you use Table Extension, the input would be the whole data frame.
Output: depending on your purpose, you can return a single value or a single column. If you use Table Extension, the output would be a table.
Now, that you know the structure of data in R and the input/output values in R. Let's go to the next part to input the R script in Tableau Desktop to return values.
2/ How to write the R script to return values in Tableau Desktop
Before opening Tableau Desktop, we need to open the R Console to run the Rserve executive file. If you haven't installed Rserve or don't know how to run Rserve on R Console, you can check my previous blog here.
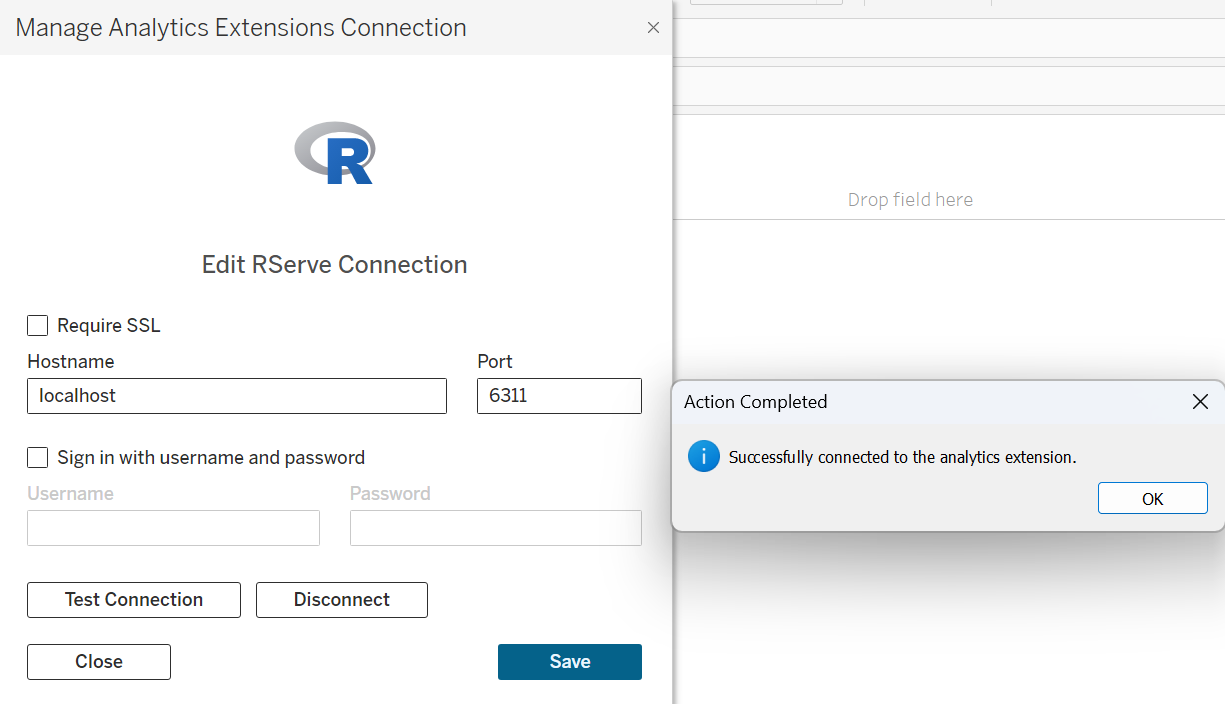
Then, you can open Tableau Desktop and test the connection (Fig. 6).
I use Sample-Superstore data source in Tableau Desktop as an example dataset for this blog.
Return a single-value
To return a single value in Tableau Desktop, we can use the calculated field with 4 SCRIPT functions. Depending on the data type of the returned value, you can decide which functions to use.
For example: I would like to find the total quantity in the whole dataset.
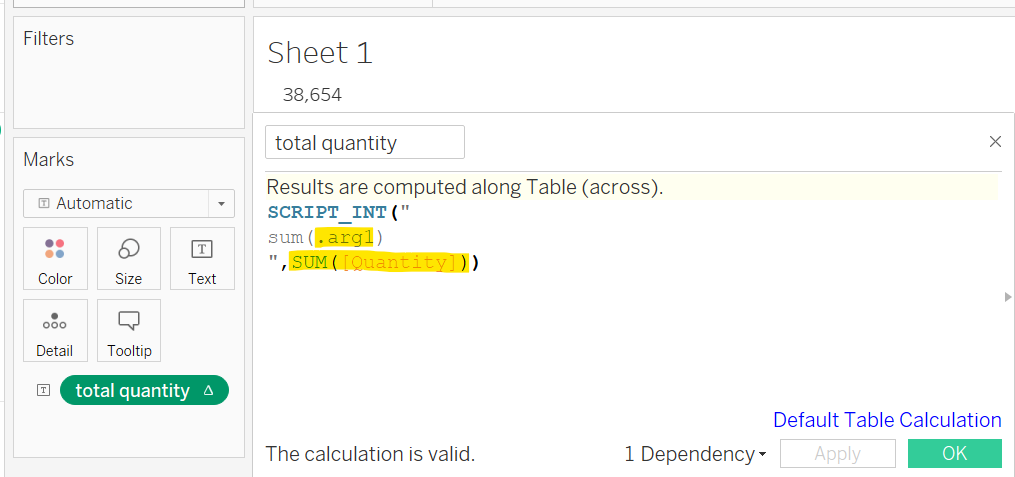
I know that the total quantity value is an integer value, so I will use the SCRIPT_INT function in the Calculated Field to return the value. As you see in Figure 5 above, I used the sum() function to pass the column Quantity in.
In Tableau Desktop, the R script is inside the SCRIPT function between the double quotation mark. After the comma is the field that we want to pass in. Remember that the field should be aggregated by a function.
Then, I drag the total quantity calculated field into the Text Marks. It will show the result of 38,654.
Return a single-column
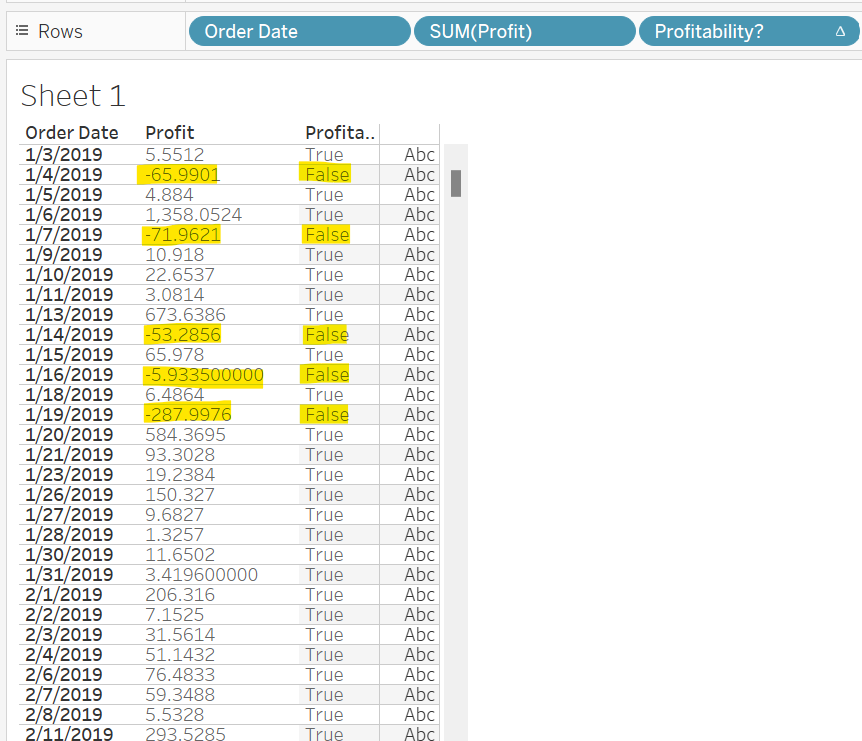
I drag the Order Date, and SUM([Profit]) as discrete fields into Rows (Fig. 8). Now, I would like to check the profit by each Order Date. If the profit is greater than 0, return True; otherwise, return False.
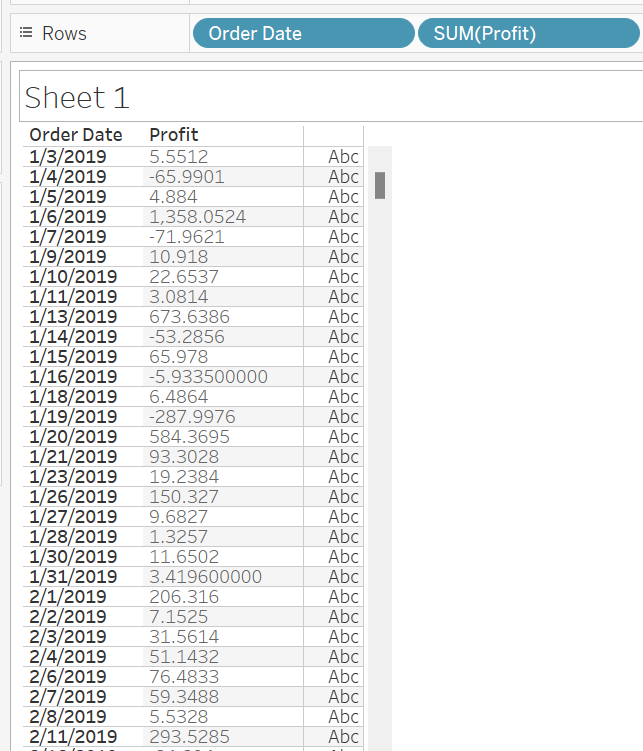
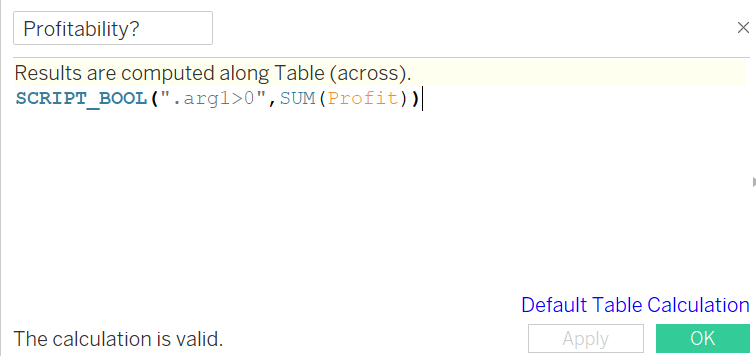
Then, I created a new calculated field called "Profitability?". Automatically, Tableau recognizes that the calculated field is using Table Calculation if we type the SCRIPT function.
In that calculated field, I typed
SCRIPT_BOOL(".arg1>0", SUM(Profit))
The data type of returned value is True or False, so I have to use the SCRIPT_BOOL function. Inside the double quotation mark is my R Script. I check if SUM(Profit) is greater than 0, return True; otherwise, return False. Note that .arg1 is replaced by SUM(Profit). (Fig. 9)
Then, drag the "Profitability?" calculated field into Rows. Now, you can see the result in True or False. (Fig. 10)
If you need to use any functions from any R packages, you should install that R package in the R console first. Then, import that package by using library() in the calculated field.
For example: I would like to add the tidyverse package in the SCRIPT function in the calculated field.
In Tableau, I create a new calculated field and type:
SCRIPT_INT("
library(tidyverse)
...
", SUM([Sales]))
In this part, you know how to return a single value or a single column.
In this blog, I shared the data structure in R, input/output data in R, and Tableau. I also showed how to write the R Script to return a single value or a single column in Tableau. I hope it will be helpful to you if you need to work with statistical data.
You can also use Python or R Script in Tableau Prep Builder. In the Tableau Prep Builder User Group, I shared how to apply R Script in Tableau Prep Builder. You can check the recorded video here.

You can also check my ANOVA report dashboard based on the fake data here.