


I wrote two blogs about extracting data from API in Tableau Desktop. In the first part of that series, I introduced API, JSON structure, and how to parse JSON to extract data in Tableau Desktop (Part 1). In the second part of that series, I shared the complex JSON structure, including the nested arrays and objects. Then, I showed how to parse JSON and unnest the complex JSON structure in Tableau Desktop (Part 2).
Tableau users can extract data directly from the server in Tableau Desktop with tabpy without inputting any data source. However, the disadvantage of doing that way is the performance of loading and launching the Python script. To fix that issue, Tableau users can build an ETL (Extract, Transform, Load) pipeline with Tableau Prep Builder. In this blog, I will share:
1/ Prepare the API link and set up the environment
2/ Analyze the JSON structure
3/ Write the Python script to extract the data from the API
4/ Transform and load the data into the Tableau Server
1/ Prepare the API link and set up the environment
In this blog, I use the Weather Forecast API as an example. It's open source and free. You can access this link to the Weather API: https://open-meteo.com/en/docs
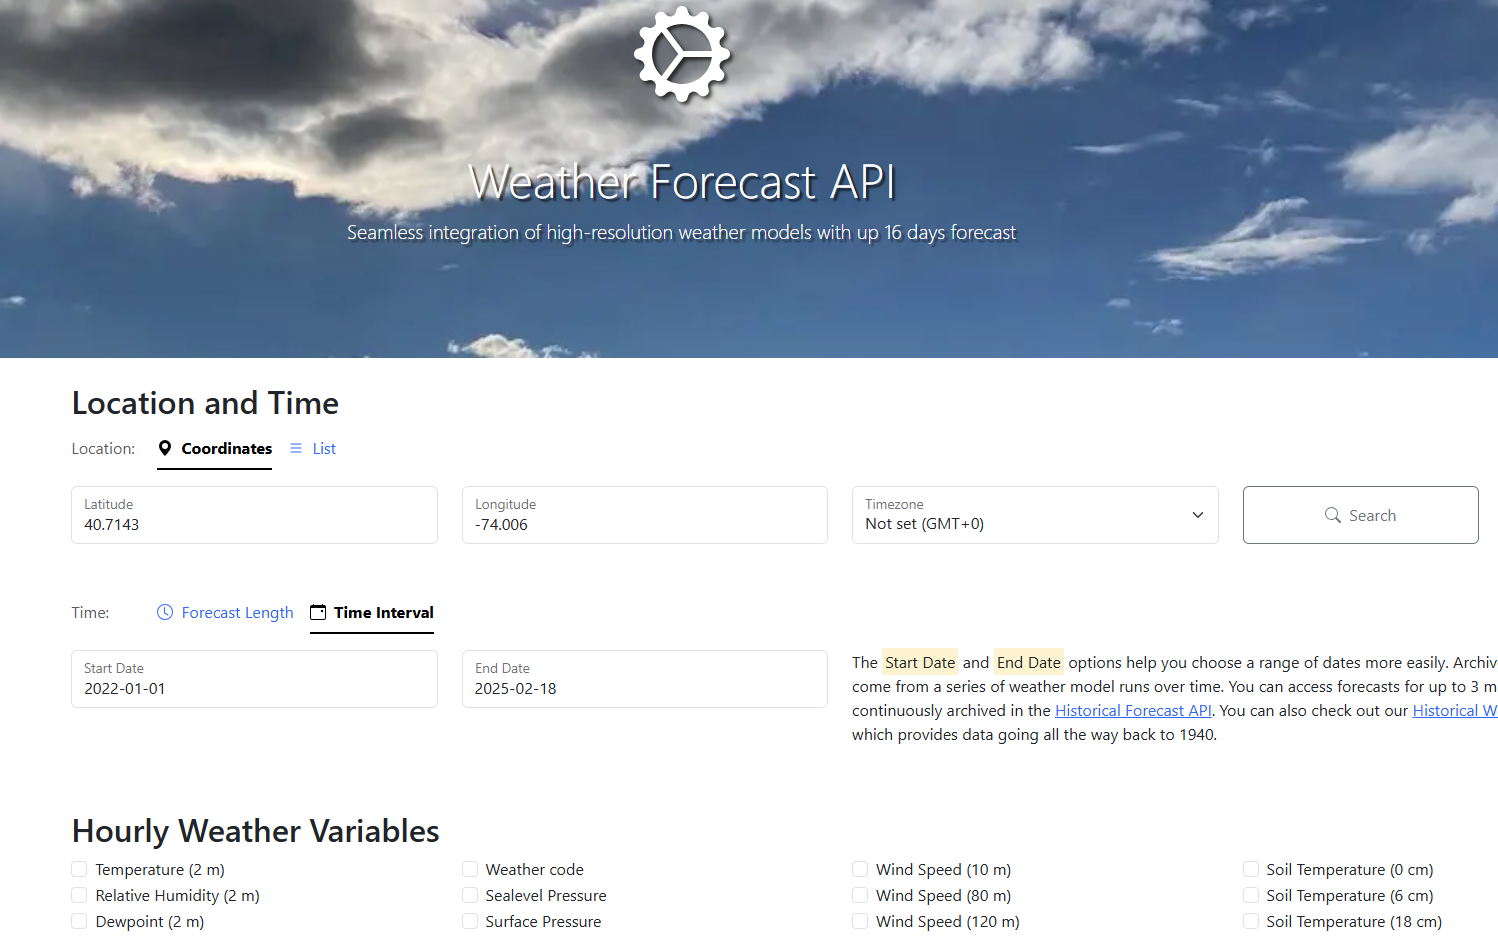
From that page, you can click on the Search button to search the location you want to get the weather data. It will return the longitude and latitude. You can also set the time interval with the start and end date.
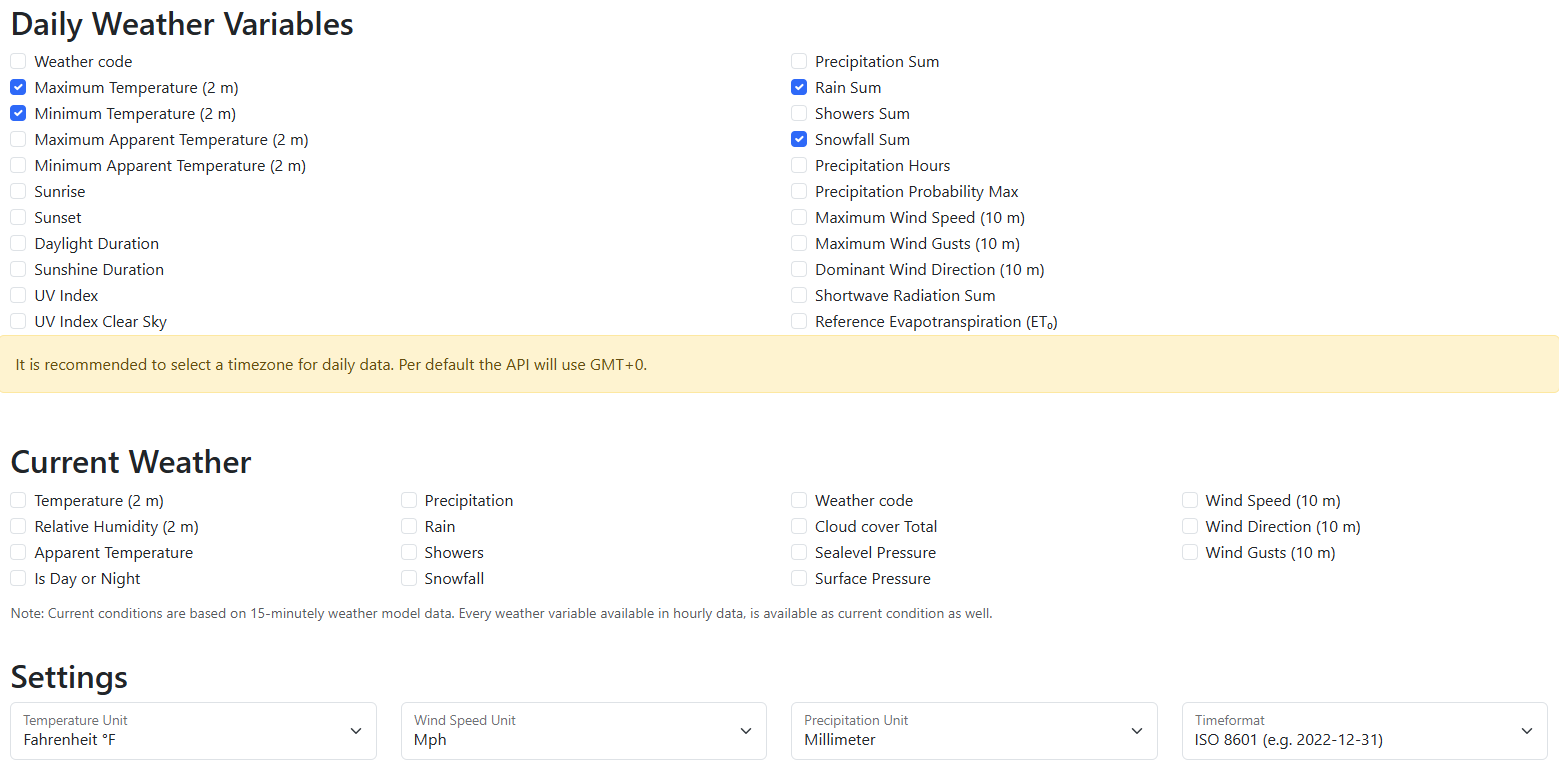
If you scroll down more, many variables represent the data you want to get with the check box at the front. For example, I want to get the minimum, maximum temperature, total rain, and snowfall daily (Fig. 2). I will check those boxes. In the settings, I will set the unit for each variable.
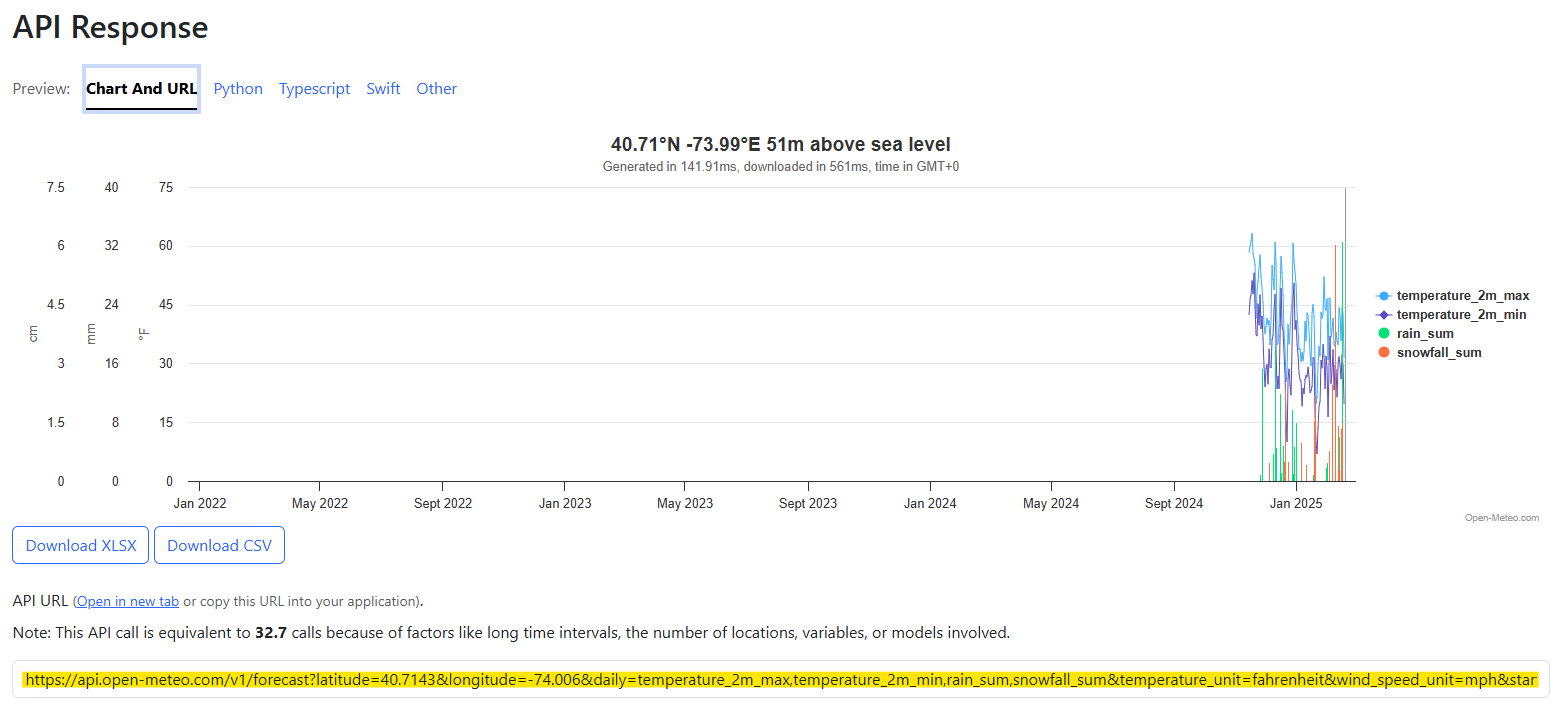
Scroll down a little bit; you will see the API Response with the Chart and URL. It shows the chart and the API link. I copy that URL and paste it into a new tab.
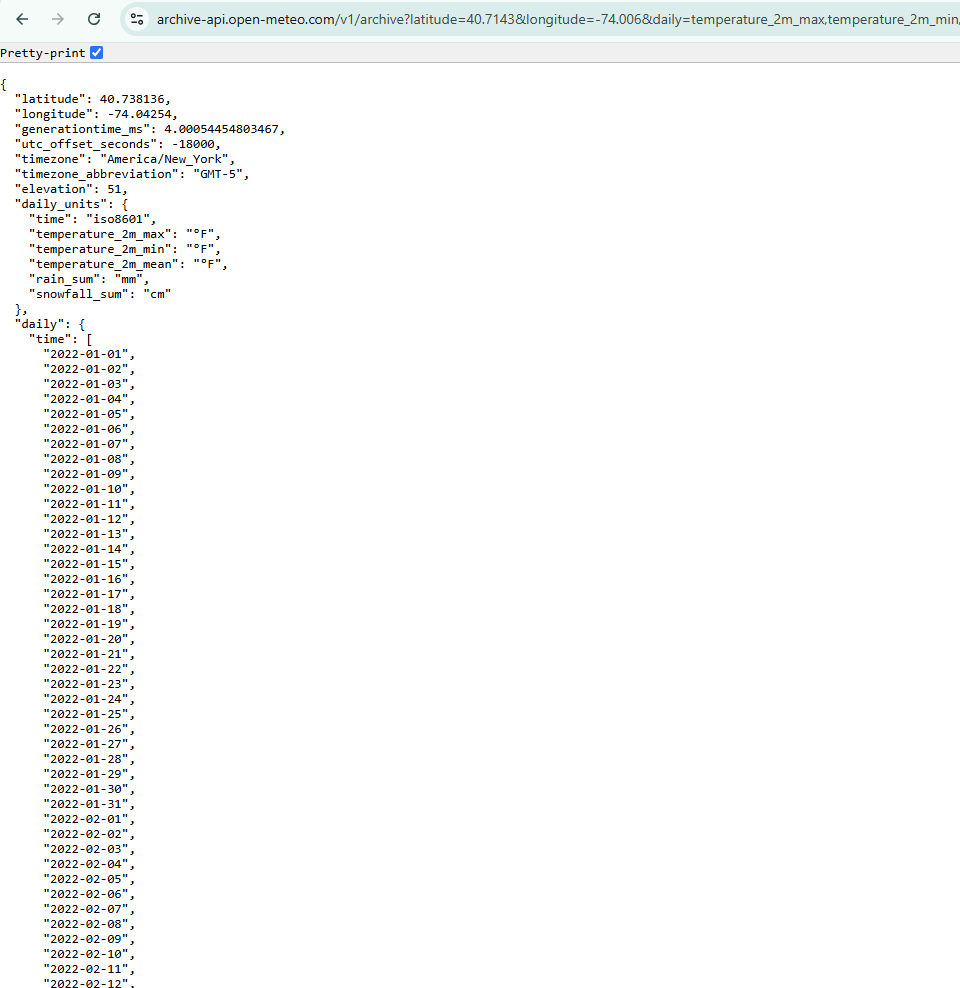
After pasting the URL in a new tab, and if your web browser installed the JSON editor to read, it will show the same as I have in Fig. 4.
Note: The Weather Forecast API in this example is free, so I don't need to set the headers to send the POST and GET requests to the server.
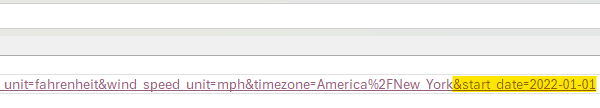
I also copy that URL into an Excel file and save it. Noted that I only use the start date parameter and deleted the end_date parameter. I will add the end_date later in Tableau Prep Builder to get the latest date.
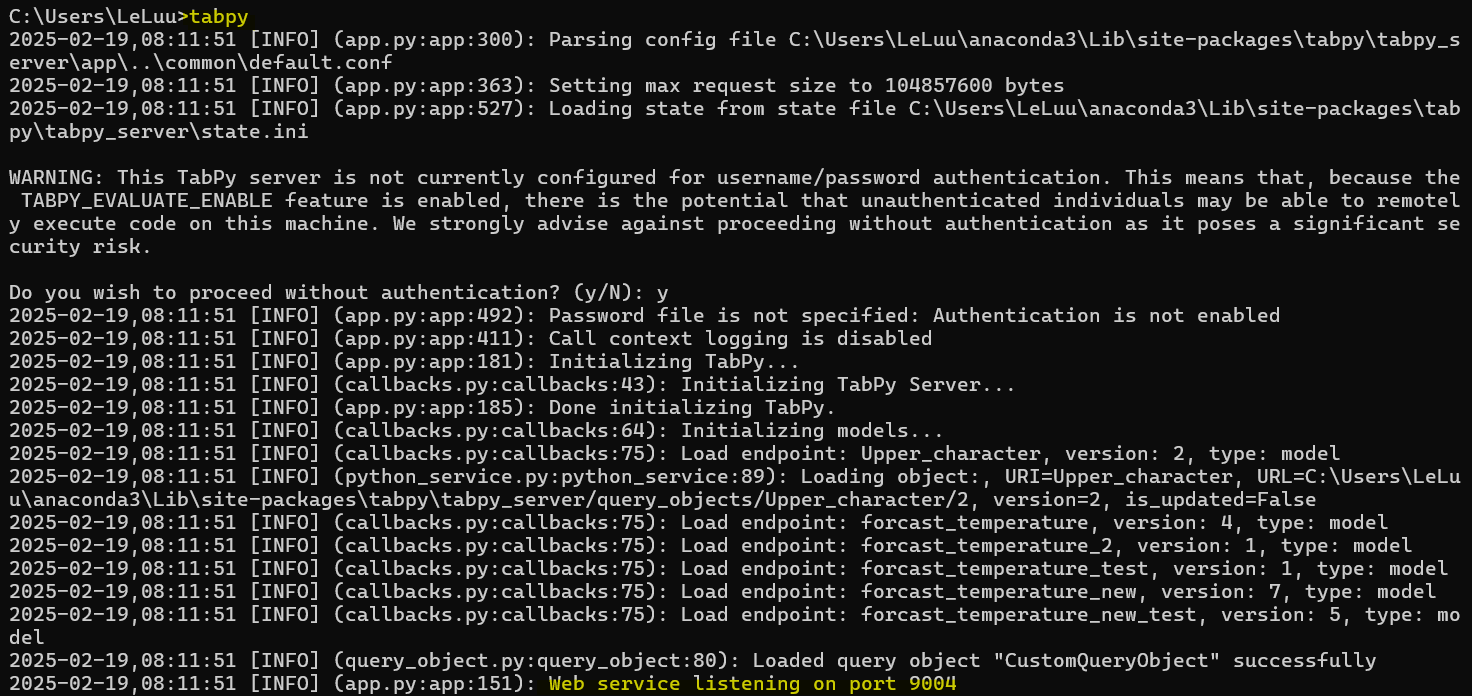
Then, I need to activate the tabpy on my local computer to test the script. If you haven't installed tabpy, you can check my previous blog here. I open the Command Prompt on Windows and type tabpy to activate it (Fig. 6).
In Tableau Prep Builder, I go to Help > Settings and Performance > Manage Analytics Extension Connection. Then, put the host and port number in (In my case, I use localhost with port 9004). If you already installed tabpy on Tableau Server, you can put the host, and port number with the user name and password there to sign in.
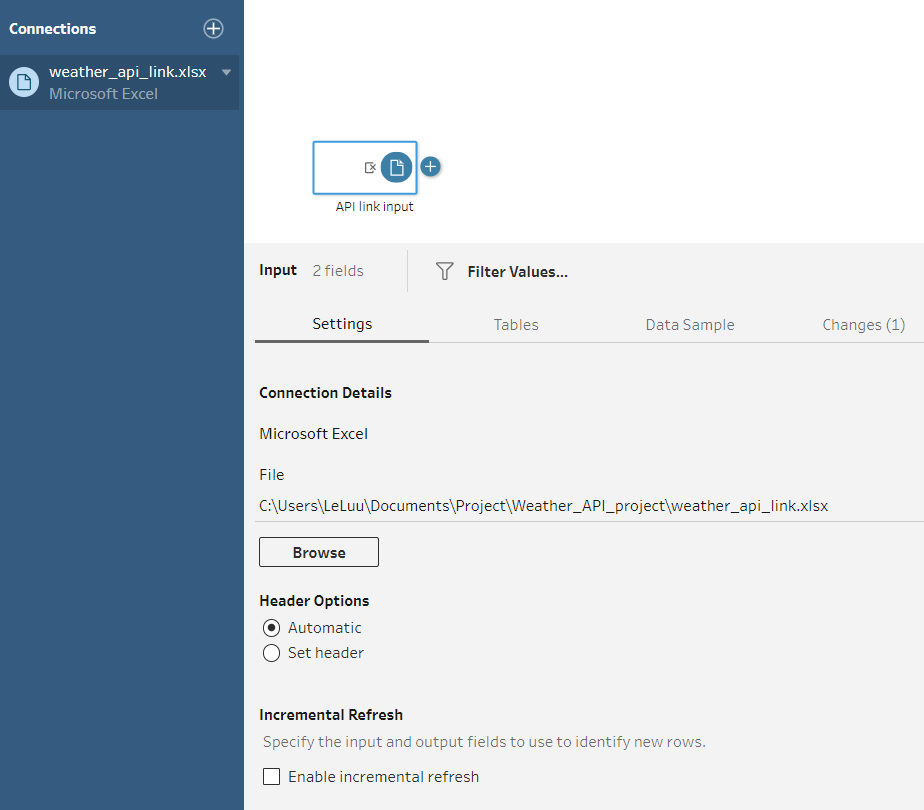
Then, I imported the Excel file containing the API link.
Next, I create a new step to concatenate the end_date parameter into the API link. This step will automatically update the API link with the latest date. In this calculated field, I concatenate the API link with "&end_date" and the STR(TODAY()). The TODAY() function will return the current date and apply the STR to convert that date into the string to concatenate.

2/ Analyze the JSON structure
As you saw the JSON structure from Fig. 4 above, it's quite hard to read the structure to see if that object contains the nested objects/ arrays or how many of them are in the JSON structure. So, I visualize it as in Fig. 9.

From Fig. 9, the black text represents the key/ value of the objects, while the blue text represents the array. There are two nested objects (daily_units and daily). The values of the daily_units are key-value pairs. The daily object contains many arrays. Each array contains a list of values.
Our purpose is to extract the data from those arrays. Each array would be a column in the table.
3/ Write the Python script to extract the data from the API
You can use any Text Editor to write the Python script. I used three packages:
- requests package: to send the GET request to the server to get the response
- pandas package: to store the response in the data frame
- JSON package: to parse JSON
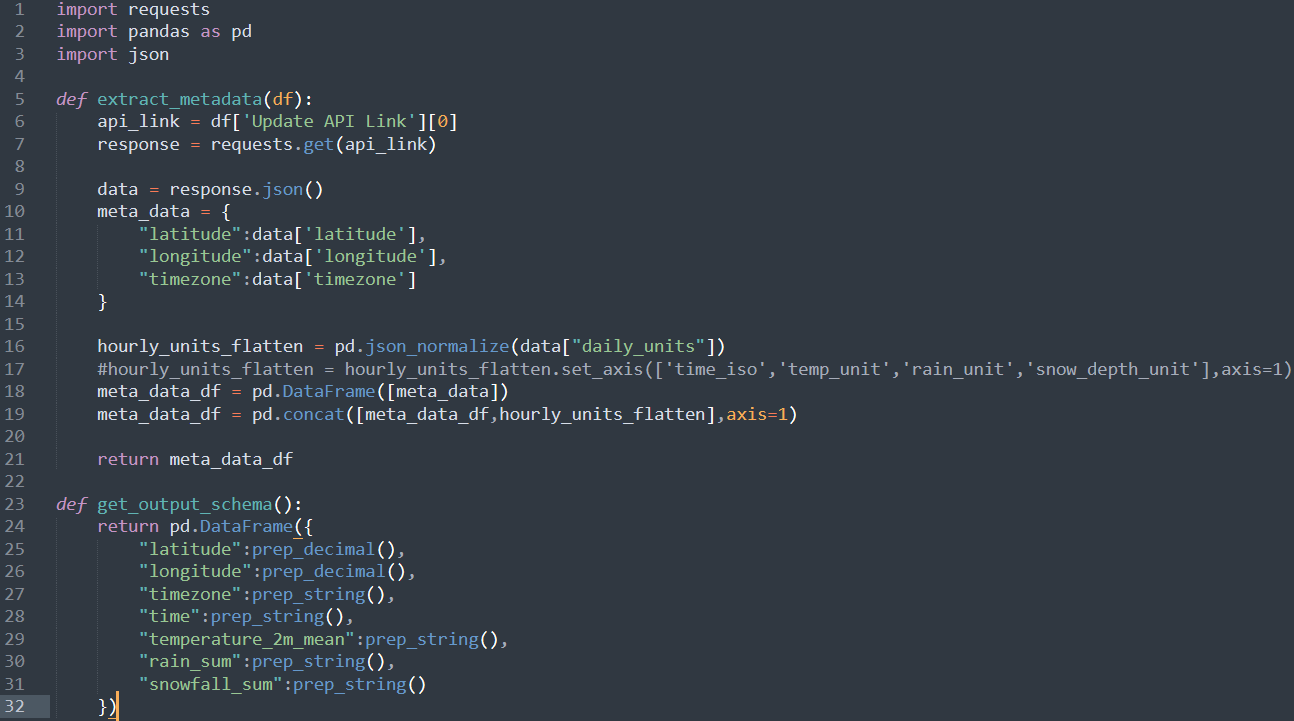
Then, I write a function to extract the data. In Tableau Prep Builder, later, you will need to put the function name in the Script step. To declare a function in Python, I use def <function_name> (parameter). The input to this function is the output of the Clean step in Fig. 8 above. So, I use df as the name of the parameter to pass into the extract_data function.
Inside the extract_data function:
- In line 6, I assigned the first row of the "Update API Link" column into the api_link variable.
- In line 7, I used the get() function from the requests package to send the GET request to the server with that api_link. If it's successful, it will return data into the response variable.
- As you know, the response is the JSON structure in Fig. 4 above. I only want to get the data from the daily object, which contains many arrays. In line 9, the response variable is the JSON format, so I apply the JSON function to parse. I only want to get data from the "daily" object. Then, I assigned it to the data variable.
- In line 11, I store the data (multiple arrays) into a pandas data frame.
- In line 12, return the data frame.
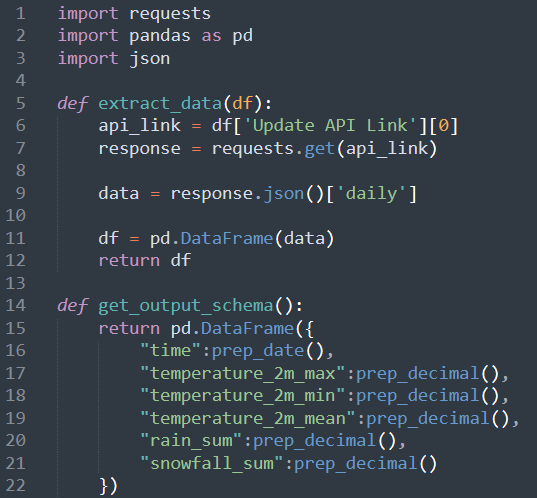
In Tableau Prep Builder, we need the function get_output_schema in the script to define the output and data types. I know there are six columns in the data frame. For each column, I defined the data types following the data type table from Tableau.
Then, I saved it with the name extract_data_python_script.py
In Tableau Prep Builder, I connect the Script step to the Clean step.

Click on the Script step, and choose Settings panel.
Connection Type: Tableau Python (TabPy) Server.
Server: make sure that the host and the port number are correct.
File Name: Choose the Python file that you just saved.
Function Name: the function name that you defined in the Python script.
If everything is correct, then you will see the data in the table. You can also try to extract the metadata from the API.
4/ Transform and load the data into the Tableau Server
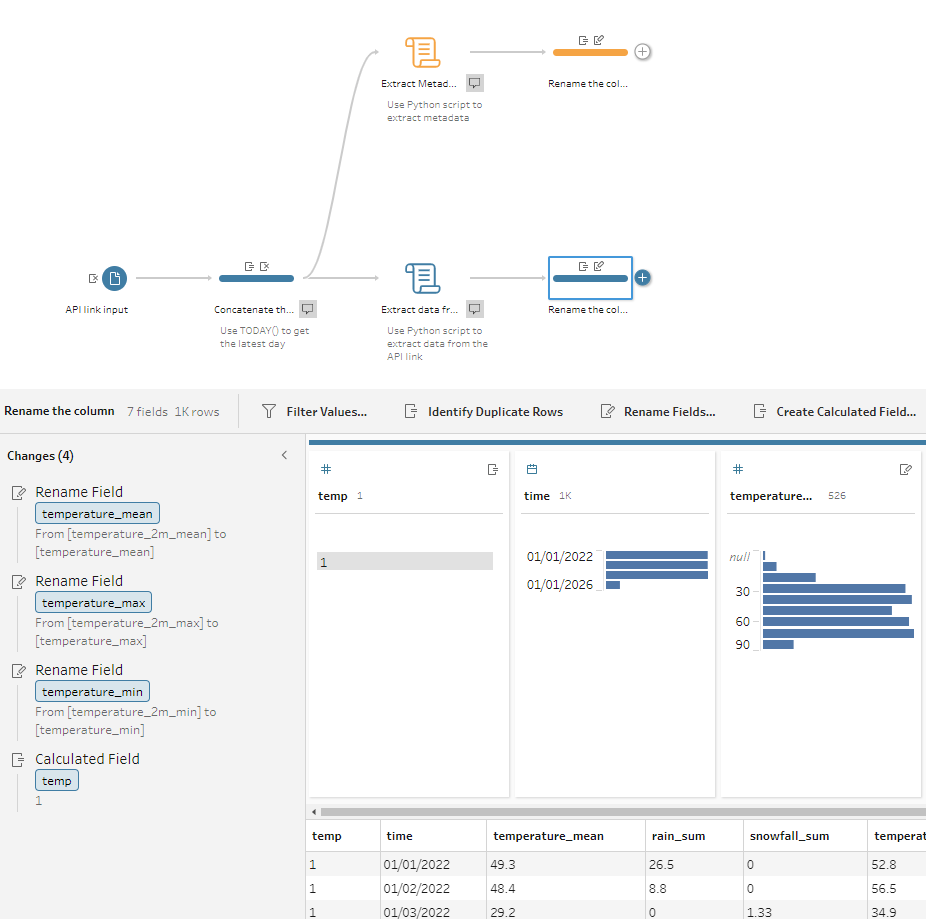
After extracting data from the API, I connect the Clean step with the Script step to rename the column name. Currently, I have two branches. One branch is the daily data with the temperature min/max/mean snowfall sum and rain sum (blue branch). The other branch is the metadata (orange branch), which stores the unit of each metric, the longitude, and latitude.
I would like to combine those two branches. For each Clean step of each branch, I created a new calculated field, "temp" with any text/number.
Then, join 2 of those branches with the temp column.
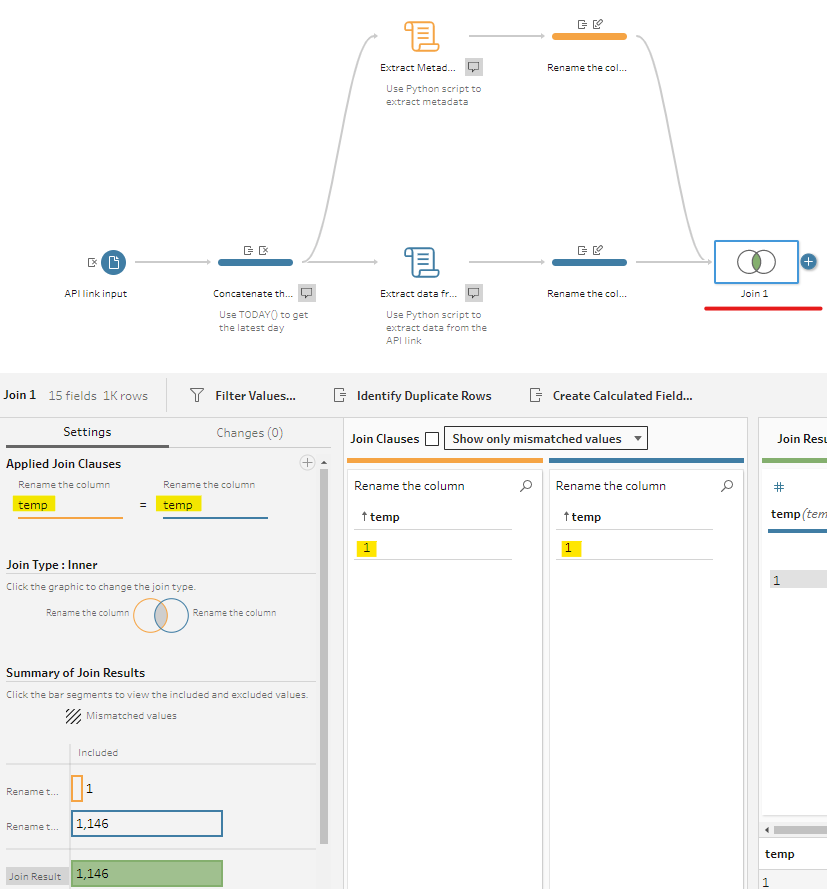
After joining, I removed those 2 temp columns and renamed some fields.
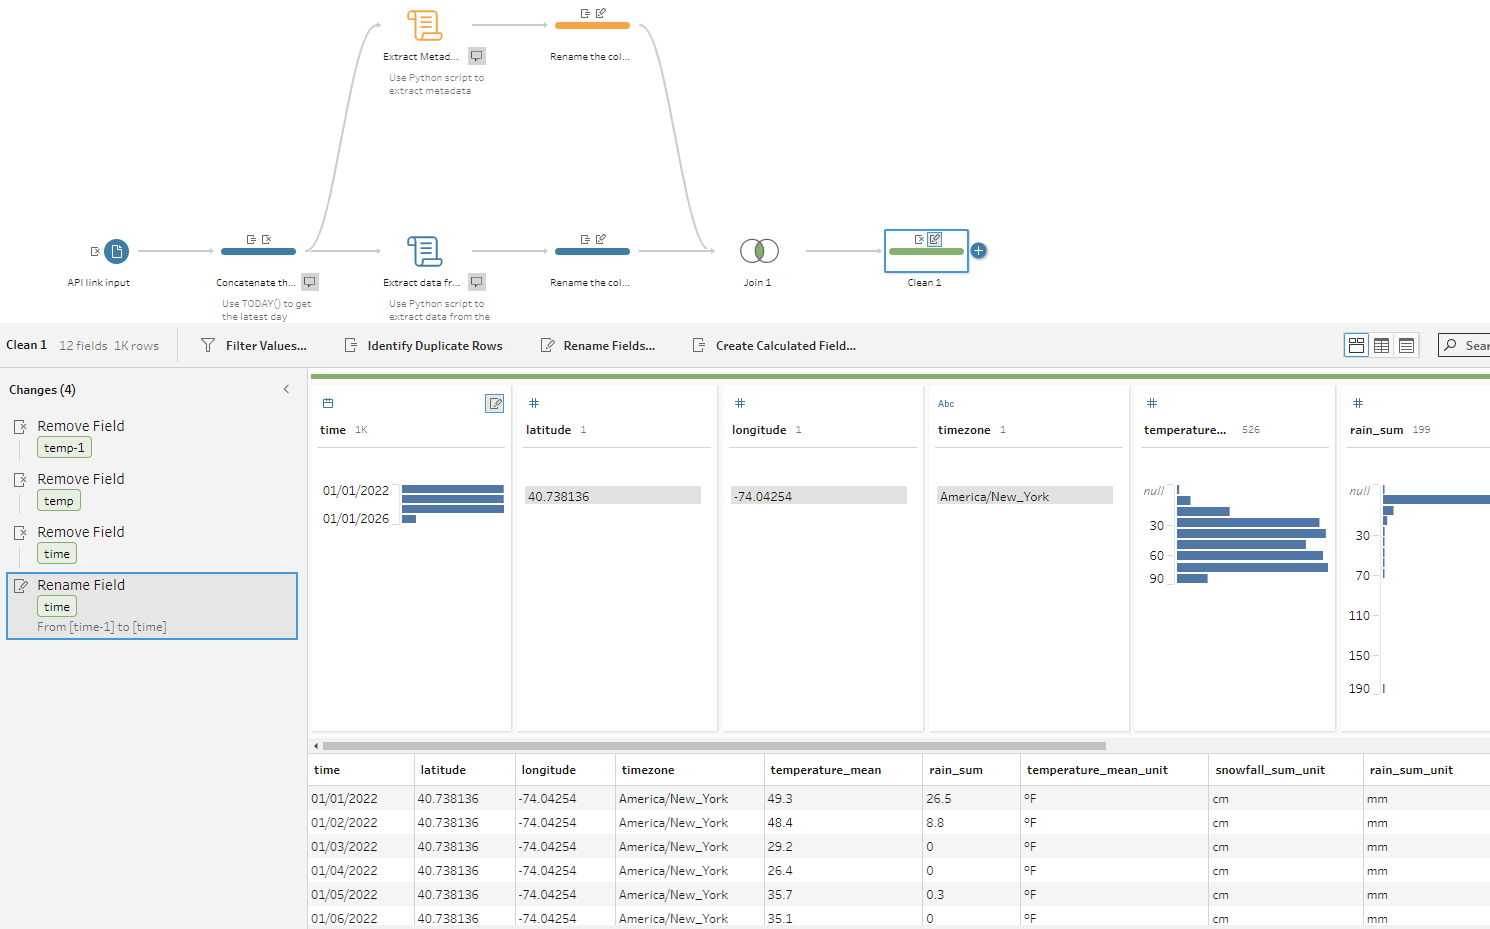
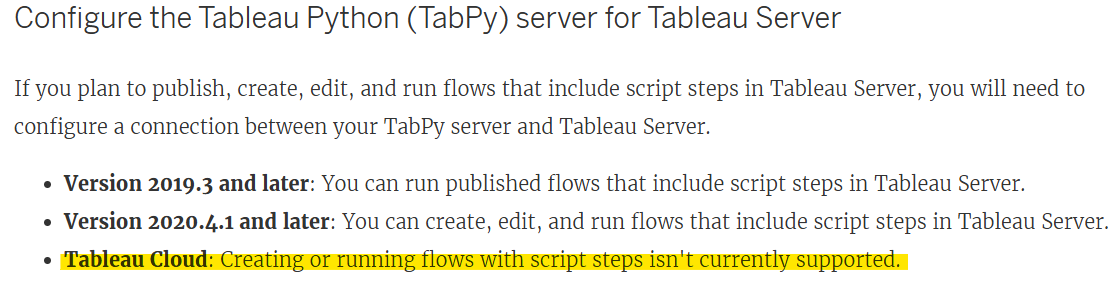
From here you can output the data source as a hyperfile or publish the workflow/ data source to the Server/ Cloud and schedule it to run automatically. However, Tableau Cloud cannot run the flow with the Script step.
In this blog, I shared how to extract the data from API in Tableau Prep step by step from how to prepare the API link, set up the environment, analyze the JSON structure, write the Python script, and transform the data before loading it into Cloud/ Server.
I hope this blog is helpful to you; especially if you are looking for another option to extract the data from API. This option helps to improve the performance in Tableau Desktop when you build the dashboard since the data source is published on the Cloud/ Server. However, there is an issue if you only use Tableau Cloud. You cannot schedule the workflow to run on Tableau Cloud. In another blog, I can share how to extract data from the API and publish the data source to Tableau Cloud without using Tabpy.
Thank you for reading!